
Kapitel 3: Chart-Grundlagen und Price Action
Lesson Learning Objectives:
Einführung: In Chapter 3, we embark on demystifying Chart Basics, Price Action, and the crucial role of Understanding Timeframes, pivotal for anyone engaged in financial trading. This exploration covers the nuances of reading various chart types, such as line, bar, and candlestick charts, and understanding how price movements reflect market sentiment. Additionally, the chapter emphasizes the importance of selecting appropriate timeframes to align with trading strategies, from minute-by-minute analysis to broader monthly overviews. Equipping yourself with this knowledge enhances your ability to spot trading opportunities, interpret market trends dynamically, and make informed decisions, thereby significantly improving your trading success.
- Familiarize Yourself with Different Chart Types: Learn the characteristics and applications of line, bar, and candlestick charts to gain unique insights into market data.
- Understand Price Action and Its Importance: Comprehend how price movements reflect underlying market sentiment and guide trading strategies.
- Recognize Key Patterns in Price Action: Identify common patterns that signal potential market movements, enabling effective anticipation and reaction to market changes.
- Grasp the Significance of Different Timeframes: Understand the impact of various timeframes on analysis, strategy development, and execution.
- Integrate Multiple Timeframe Analysis for Comprehensive Market Views: Discover the benefits of analyzing multiple timeframes to obtain a holistic understanding of market trends and patterns.
Einführung
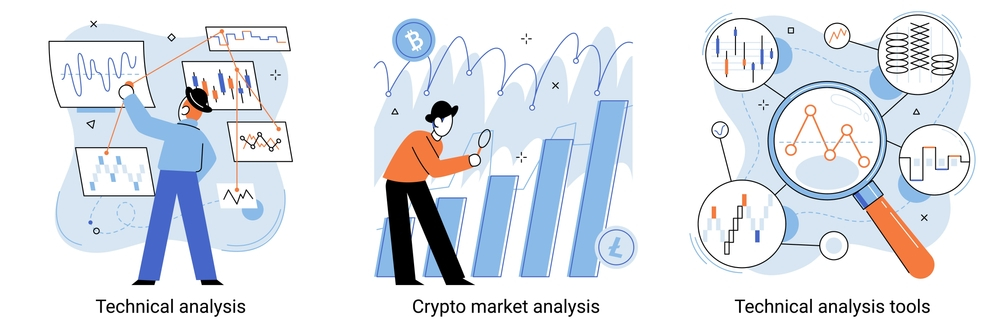
Figur: A vector illustration of a technical trader analyzing stock charts. The image includes a set of technical analysis tools and represents investment stock trading based on chart graphs. It also highlights digital currency market transactions and electronic money, emphasizing the modern aspects of financial trading.
Quelle: Shutterstock
Consider the chart as a map guiding your journey through the terrain of financial markets. They serve as a visual representation of market activity, granting us the ability to spot trends, patterns, and potential trading opportunities. In this chapter, we’ll introduce you to the fundamental chart types, the art of reading price action, and the concept of timeframes. Let’s chart our way to success!
A. Types of Charts
Figur: A comprehensive vector set illustrating various aspects of stock market investment trading and technical analysis. It includes candlestick, bar, line, and area charts. This image effectively represents the tools and graphs used by traders for financial investment analysis and market trend evaluation.
Quelle: Shutterstock
Charts come in various forms, each offering unique insights. In this course, we’ll focus on the three most widely used chart types: Line Charts, Bar Charts, and Candlestick Charts.
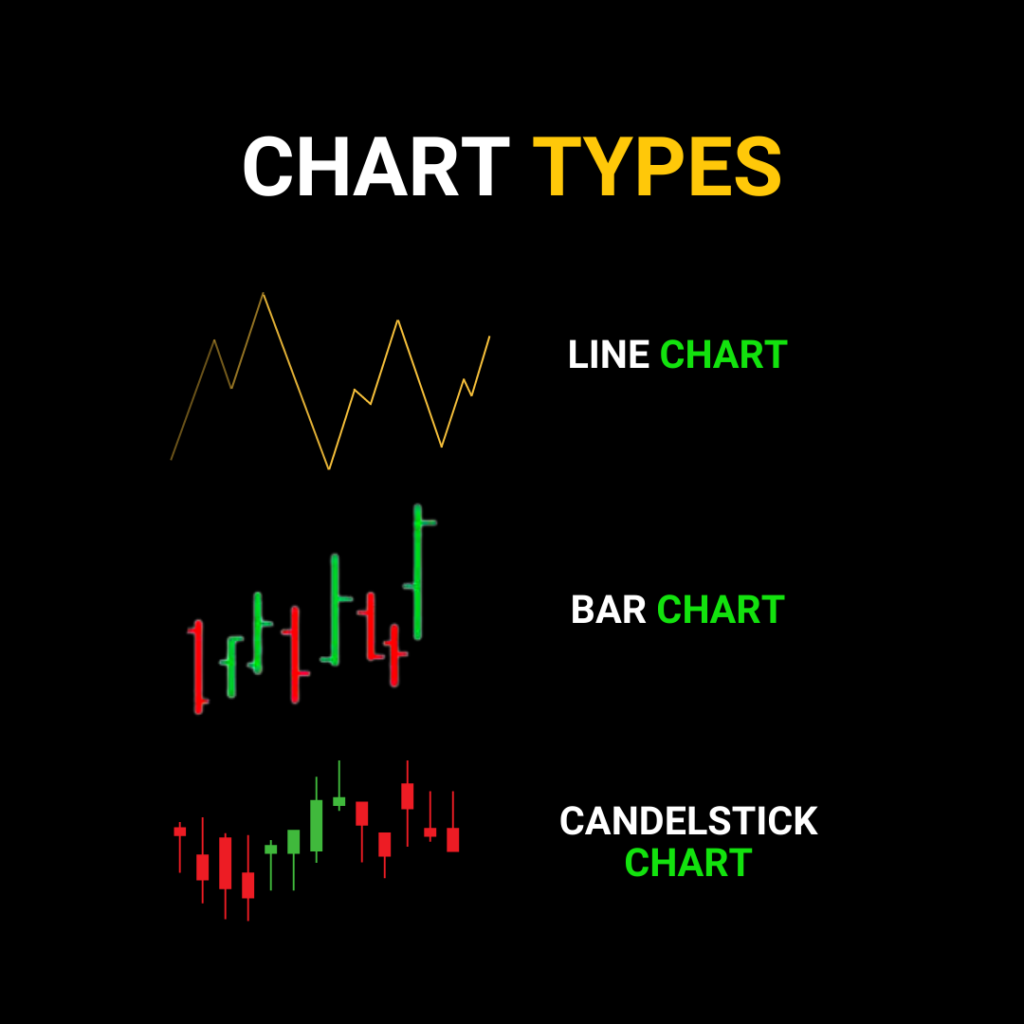
Figure: Types of Financial Charts
Beschreibung: This infographic provides an overview of different types of charts commonly used in financial analysis. It includes the ‘Line Chart,’ which is basic and shows price movements over time with a single line. The ‘Candlestick Chart’ is more detailed, representing price movements with bars and wicks, showing open, close, high, and low prices. The ‘Bar Chart’ is similar to the candlestick but uses simple bars to represent price movements. Understanding these chart types is crucial for traders and investors as they offer different perspectives on market data and trends.
Quelle: Benutzerdefinierte Infografik
- Line Charts: are the simplest form of charting, they plot the closing price of a security over time, connected by a line. They offer a clean, straightforward visualization of a security’s price movement but lack the finer details offered by more complex chart types.
- Bar Charts: offer more detail than line charts. Each bar represents a specific period (like a day, week, or hour), with the top and bottom of the bar marking the high and low prices for the period, respectively. The opening and closing prices are shown using horizontal ‘ticks’ on the bar.
- Candlestick Charts: A favorite among traders, candlestick charts, like bar charts, illustrate the opening, closing, high, and low prices for a period. However, they use a ‘body’ (the colored area) to highlight the range between opening and closing prices, making price patterns easier to spot.
Example: We might compare a line chart to a general road map, a bar chart to a topographic map with more details, and a candlestick chart to a 3D satellite map offering a comprehensive view.
Line vs Bar vs Candlestick charts
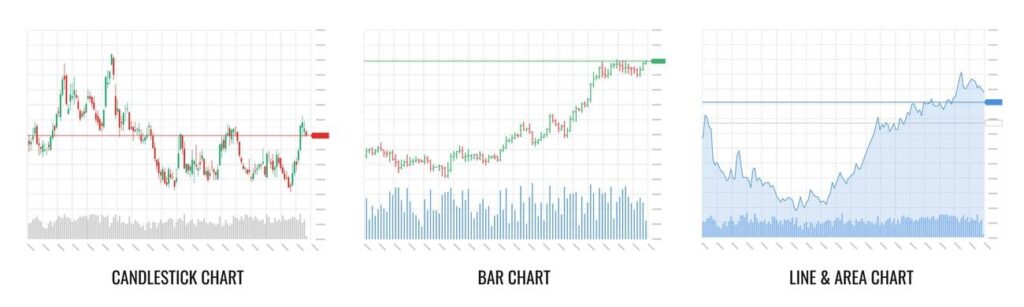
Figure: Comparison of Line, Bar, and Candlestick Charts
Quelle: FXSSI
Beschreibung: The image compares three popular types of financial charts: Line, Bar, and Candlestick charts. Each chart type presents data differently. The Line chart is the simplest, showing only the closing prices of a security over time, creating a single continuous line. The Bar chart provides more detail, displaying the opening, high, low, and closing prices (OHLC) for each period as a vertical line with small horizontal ticks. The Candlestick chart, the most detailed, also shows the OHLC prices but in a more visual way, using ‘candles’ to represent price movements. The ‘body’ of the candle indicates the opening and closing prices, while the ‘wicks’ or ‘shadows’ show the high and low.
Die zentralen Thesen:
- Line Chart: Shows only closing prices, offering a simplified view of price movements.
- Bar Chart: Provides OHLC prices, giving a more detailed view than the line chart.
- Candlestick Chart: Most detailed, visually representing price movements with candles.
- Data Representation: Each chart type offers a different level of detail and visual representation of the data.
Anwendung: Understanding the differences between these chart types is essential for traders and investors, as it influences how they interpret and analyze market data. Line charts are useful for a quick overview of price trends, while bar and candlestick charts are better for detailed analysis, including identifying patterns and potential market reversals. Candlestick charts, in particular, are popular in technical analysis due to their detailed and visually intuitive representation of price action. Choosing the right chart type depends on the trader’s strategy and the level of detail required for their analysis
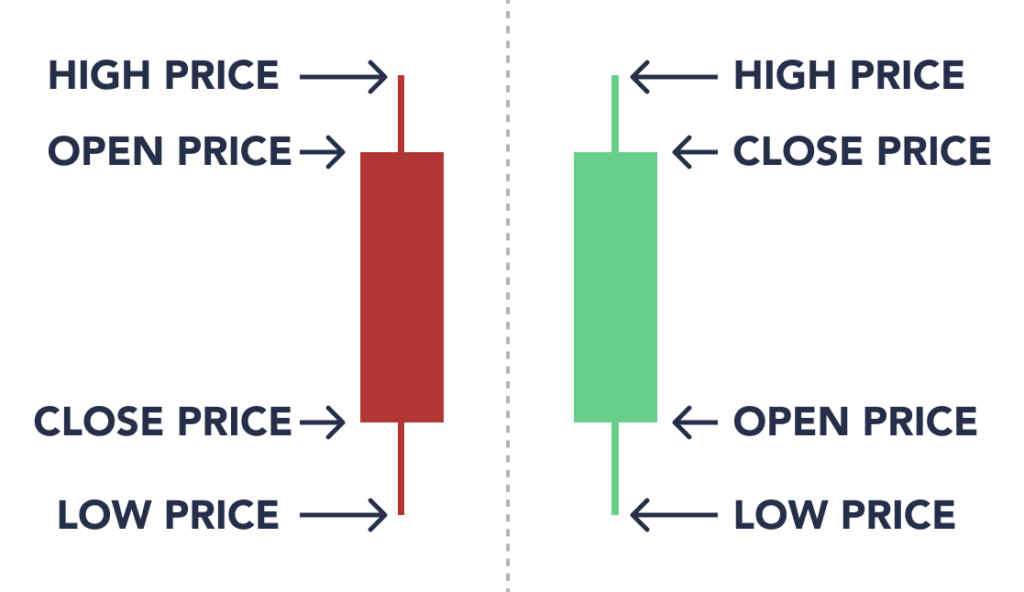
Figure: Understanding Candlestick Chart Components
Quelle: River
Beschreibung: The image is an illustrative guide to understanding the components of a candlestick in a candlestick chart. It shows two types of candlesticks: one where the opening price is lower than the closing price, and another where the opening price is higher. Each candlestick consists of a ‘body’ (the wide part) and ‘wicks’ or ‘shadows’ (the thin lines at the top and bottom). The top of the upper wick represents the high price, while the bottom of the lower wick represents the low price. The body’s top and bottom indicate the opening and closing prices, with the color of the body typically showing whether the closing price was higher or lower than the opening price.
Die zentralen Thesen:
- Candlestick Components: Consists of a body and wicks, representing different price points.
- Price Representation: The top and bottom of the body show the opening and closing prices, while the wicks represent the high and low prices.
- Color Coding: The color of the candlestick body indicates whether the closing price was higher or lower than the opening price.
- Price Movement: Candlesticks visually represent the price movement of an asset within a specific time frame.
Anwendung: Candlestick charts are a fundamental tool in technical analysis for traders and investors. Understanding how to read candlesticks allows for better interpretation of market sentiment and potential price movements. For instance, a candlestick with a long lower wick and a short body at the top may indicate a potential reversal from a downtrend to an uptrend. This knowledge is crucial for making informed decisions about entry and exit points in trading, and for identifying bullish or bearish market trends.
B. Reading Price Action

Figur: A hand-drawn style vector illustration of a business man contemplating over a triangle of conflicting interrelated values: time, money, and quality. This image effectively captures the concept of balancing critical factors in business decision-making.
Quelle: Shutterstock
Figur: A vector illustration depicting the concept of Forex candlestick pattern trading. The image presents a detailed financial market chart, highlighting the intricacies of price action in trading. It serves as a visual representation of financial market analysis and trading strategies.
Quelle: Shutterstock
Price action is the movement of a security’s price over time, depicted on a chart. It’s like the heartbeat of the market, showing us the market’s emotions. Traders use price action to identify patterns, trends, and potential trading signals.
By observing how the price fluctuates—how it reacts to highs and lows, or how swiftly it moves within certain ranges—you can start to understand the market sentiment (bullish, bearish, or neutral) and make informed trading decisions.
Example: If you notice a recurring pattern where the price of security tends to bounce back up after hitting a certain low point, you might interpret it as a strong support level where buyers step in.
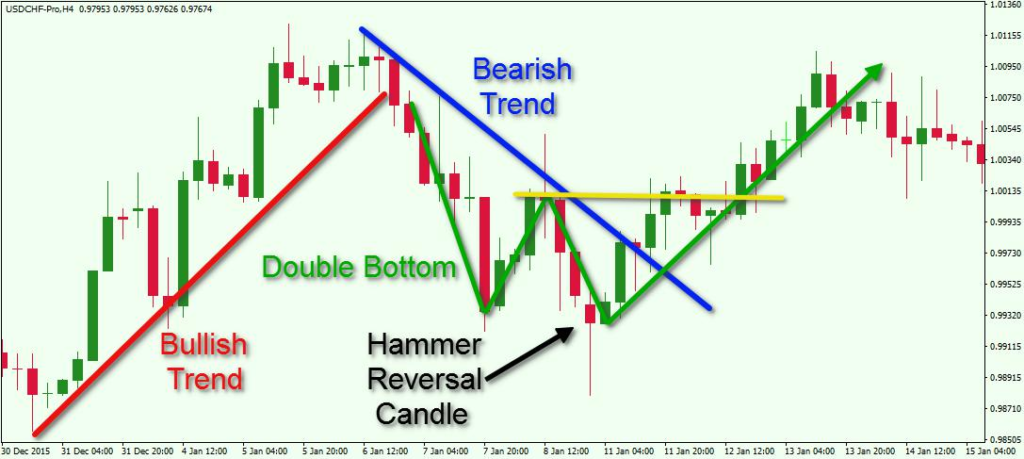
Figure title: Forex Price Action Trading
Quelle: Forex Training Group:
Beschreibung: The image is a visual representation of Forex price action trading, specifically highlighting a ‘Bullish Hammer’ candlestick pattern. This pattern is often considered a signal for a potential trend reversal in the Forex market. The candlestick has a small body with a long lower wick, indicating that the price was driven down during the trading period but then strongly pushed back up, closing near the open.
Die zentralen Thesen:
- Bullish Hammer Pattern: Recognized by its small body and long lower wick, suggesting a shift from bearish to bullish sentiment.
- Trend Reversal Indicator: This pattern is often seen as a signal for a possible upward trend in the market.
- Forex Trading Strategy: Traders use such patterns to make informed decisions about entering or exiting trades based on potential market movements.
Anwendung: Forex traders can use the Bullish Hammer pattern as part of their technical analysis to identify potential buying opportunities in the market. It’s important to combine this with other indicators and analysis methods for more reliable trading decisions.
C. Understanding Timeframes

Figur: A vector illustration showcasing a 1-hour time frame FX trade, depicting an uptrend in the stock market or forex trading graph. This graphic concept is suitable for representing financial investment or economic trends, and it visually communicates the dynamics of short-term market movements in trading.
Quelle: Shutterstock
Timeframes refer to the length of the period represented by each point (line chart), bar (bar chart), or candlestick (candlestick chart) on a chart. Choosing the right timeframe depends on your trading style.
Long-term investors might use daily, weekly, or monthly charts to analyze long-term trends, while day traders might use hourly, 15-minute, or even 1-minute charts for short-term trading opportunities.
Remember, analyzing multiple timeframes can offer a more holistic view of the market and help confirm trends or signals spotted in a single timeframe.
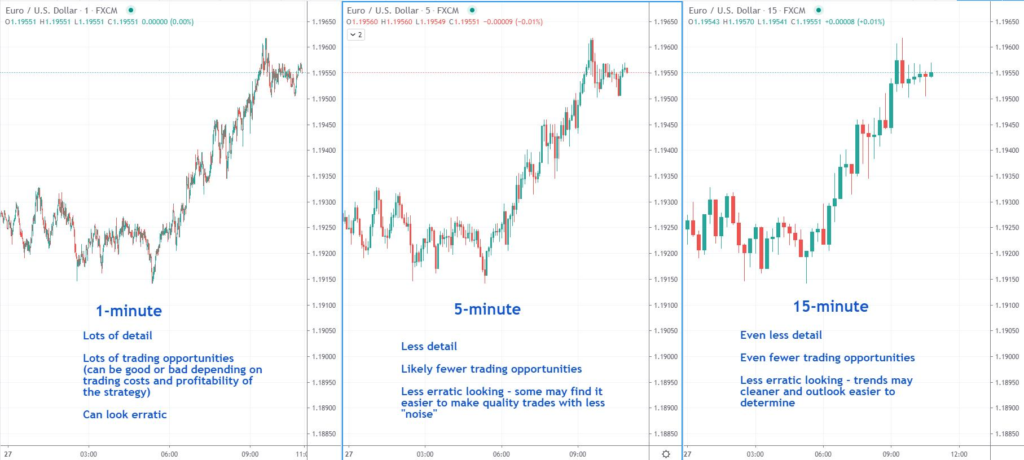
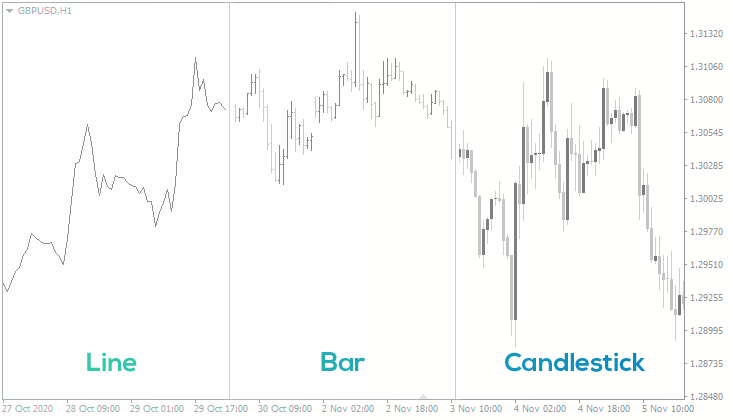
Figure: Time Frame Comparison in Forex Trading
Quelle: Trade That Swing
Beschreibung: The image compares different time frames in Forex trading using the EUR/USD currency pair. It shows three separate charts: a 1-minute chart, a 5-minute chart, and a 15-minute chart. Each chart provides varying levels of detail and potential trading opportunities. The 1-minute chart offers the most detail with many trading opportunities but can appear erratic. The 5-minute chart has less detail and fewer trading opportunities, providing a balance between detail and clarity. The 15-minute chart offers even less detail and fewer trading opportunities, but trends may appear cleaner and the overall market outlook easier to determine.
Die zentralen Thesen:
- 1-Minute Chart: Offers lots of detail and trading opportunities but can look erratic.
- 5-Minute Chart: Provides a balance with less detail and fewer trading opportunities, reducing “noise”.
- 15-Minute Chart: Shows even less detail, with fewer trading opportunities, but clearer trends and easier market outlook determination.
- Time Frame Selection: Choosing the right time frame is crucial for trading strategy effectiveness.
Anwendung: For day traders and Forex market participants, selecting the appropriate time frame is key to aligning with their trading strategy and risk tolerance. Shorter time frames like the 1-minute chart are suitable for traders who prefer quick, frequent trades and can manage the associated risks and costs. The 5-minute chart is a middle ground, offering less noise and a clearer view for quality trades. The 15-minute chart is better for traders who prefer a broader view of the market, focusing on more significant trends and reducing the likelihood of overtrading. Understanding these differences helps traders in making informed decisions about their trading style and strategy.
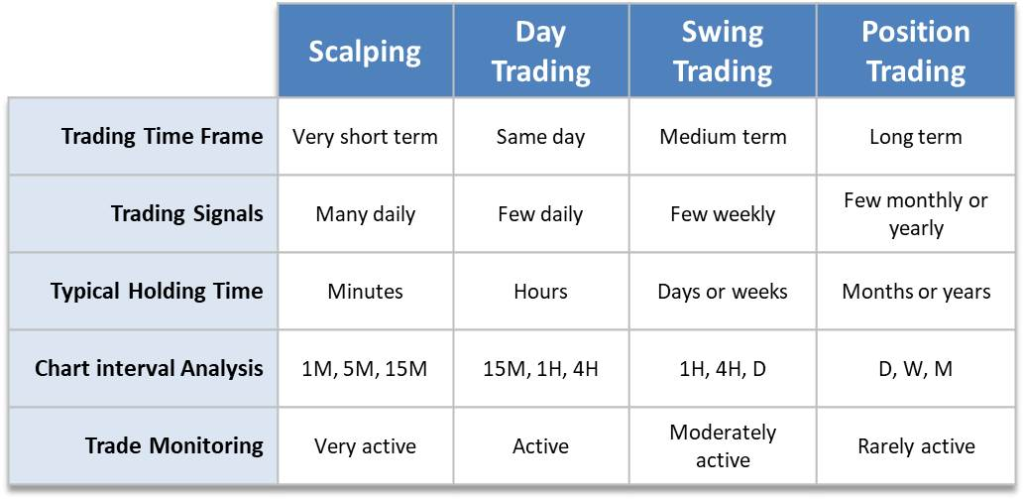
Figure title: Types of Trading Based on Time Frames
Quelle: OptimizeFX
Beschreibung: The image categorizes trading types based on different time frames and their characteristics. It breaks down trading into four main types: Long-term, Medium-term, Same day, and Very short-term. Long-term trading involves a few monthly or yearly signals, typically holding positions for months or years, and is rarely active. Medium-term trading has a few weekly signals, holding times of days to weeks, and is moderately active. Same day trading involves daily signals, holding times of hours, and is active. Very short-term trading has many daily signals, holding times of minutes, and is very active. The chart intervals for analysis vary from daily, weekly, and monthly for long-term to 1-minute, 5-minute, and 15-minute for very short-term trading.
Die zentralen Thesen:
- Long-term Trading: Involves few trading signals, longer holding times, and less frequent activity.
- Medium-term Trading: Features weekly signals, moderate activity, and holding times ranging from days to weeks.
- Same Day Trading: Characterized by daily signals, active trading, and holding times of hours.
- Very Short-term Trading: Has many daily signals, very active trading, and extremely short holding times of minutes.
Anwendung: Choosing the right trading type depends on an individual’s trading style, risk tolerance, and time availability. Long-term trading suits those who prefer a more passive approach, focusing on broader market trends. Medium-term trading balances between frequent trading and longer-term market analysis. Same day and very short-term trading are suited for those who can dedicate more time and prefer a fast-paced trading environment. Understanding these types helps traders align their strategies with their personal preferences and goals, leading to more effective and comfortable trading experiences.
Zusammenfassung
Charts serve as our guiding light in the often-chaotic financial markets. Understanding how to interpret different types of charts, read price action, and select appropriate timeframes are essential skills in technical analysis.
As you step into the next chapter of this journey, remember that, like any language, the language of charts takes time to learn. However, with patience and practice, it will become second nature.
Let’s gear up and continue our journey! With every chart we decipher, we’re one step closer to becoming adept navigators of the financial markets.
Wichtige Unterrichtsinformationen:
Schlusserklärung: Mastering Chart Basics, Price Action, and Understanding Timeframes is crucial for navigating the financial markets with precision and confidence. This chapter provides the foundational knowledge required to accurately interpret the visual language of charts and make strategic trading decisions. With a comprehensive grasp of different chart types, the ability to read and interpret price movements, and the insight to select and analyze various timeframes, you are now equipped to analyze market trends, recognize trading opportunities, and execute trades with greater confidence and effectiveness.
- Chart Types such as line, bar, and candlestick provide essential tools for analyzing financial markets, each offering different insights into market behavior.
2. Price Action reflects market sentiment, revealing clues about future movements and enabling traders to identify trends, reversals, and continuations.
3. Recognizing Candlestick Patterns and other price action signals is vital for determining market sentiment and making informed trading decisions.
4. The ability to interpret price movements and understand the significance of different timeframes is essential for developing effective trading strategies.
5. Selecting the appropriate timeframe is crucial for aligning with your trading strategy and goals, affecting both the interpretation of price action and the overall trading approach.
