
4A. Globaler Inhalt: Immobilienmärkte und Einflussfaktoren verstehen
Lesson Learning Objectives:
- Understand the impact of global economic indicators like GDP growth, employment rates, and inflation on real estate demand and pricing.
- Analyze supply and demand dynamics in major global cities, recognizing how limited space and high demand drive property prices.
- Examine the effect of political stability on real estate investment, noting how stable political environments attract investors while instability can deter investment.
- Explore the role of population growth in driving real estate demand, particularly in rapidly urbanizing cities.
4A.1 Factors that Influence Global Real Estate Markets
Real estate markets worldwide are shaped by several key factors that influence property values, demand, and investment potential:
- Economic Indicators
Global economic conditions, such as GDP growth, employment rates, and inflation, have a direct impact on real estate demand. Strong economies like those of the United States, China, Und Australien tend to have robust real estate markets, while weaker economies may see declines in property values. - Supply and Demand
In global cities with limited space, such as Hong Kong, Singapore, or New York, supply often struggles to keep up with demand, leading to high property prices. In contrast, areas with more space or slower growth may see lower prices due to excess supply. - Political Stability
Countries with stable governments, such as Kanada Und Switzerland, attract more foreign investment in real estate, as investors seek to minimize risk. Political instability, on the other hand, can drive down property prices, as seen in countries like Venezuela. - Population Growth
In cities with rapidly growing populations, such as Mumbai Und Mexico City, real estate demand continues to rise, pushing property values higher. In contrast, regions experiencing population decline, such as parts of Japan, may see stagnating or decreasing property prices.

Figur: Supply-Demand Gap in Urban Areas
Beschreibung:
This map highlights the supply-demand gap across various districts in an urban region, measured by a general index represented through a color gradient. Dark green areas indicate low supply-demand gaps, meaning supply is meeting or exceeding demand, while red and orange areas signal high gaps, reflecting unmet demand or insufficient supply. Key districts like Jianghan Und Wuchang show the largest disparities, suggesting concentrated urban pressures. Central urban areas are outlined for reference, providing a comparative spatial analysis of urban resource distribution and planning challenges.
Wichtige Erkenntnisse:
- Dark green zones represent regions with adequate supply meeting demand, likely due to balanced resource allocation or lower population density.
- Red and orange areas, such as Jianghan and parts of Wuchang, indicate significant supply deficits, requiring immediate urban planning interventions.
- Central urban areas show more prominent gaps, likely caused by higher population density and resource strain.
- The map provides insights into urban resource disparities and highlights zones requiring infrastructure development.
- Effective urban management strategies are critical for regions with high supply-demand gaps to ensure sustainable development.
Application of Information:
This data is crucial for urban planners, policymakers, and real estate developers to identify regions with unmet demand for housing, infrastructure, or services. By addressing gaps in high-demand areas, stakeholders can prioritize investments and develop targeted solutions to improve urban living conditions. For learners, the map illustrates the importance of spatial analysis in urban development and resource allocation.
4A.2 Interest Rate History and Real Estate Globally
Interest rates significantly impact real estate markets worldwide. As central banks raise or lower interest rates, the cost of borrowing changes, influencing both real estate affordability and demand.
The Inverse Relationship between Interest Rates and Real Estate
Globally, there is an inverse relationship between interest rates and real estate prices. When central banks, such as the Federal Reserve in the U.S. or the Bank of Japan, raise interest rates, the cost of financing real estate purchases increases, which can lead to a decrease in demand for property. Conversely, when interest rates are low, real estate becomes more affordable, encouraging more people to buy homes or invest in property.
For example, the low interest rates in the U.S. following the 2008 financial crisis led to a resurgence in the housing market, while rising rates in recent years have slowed housing demand.
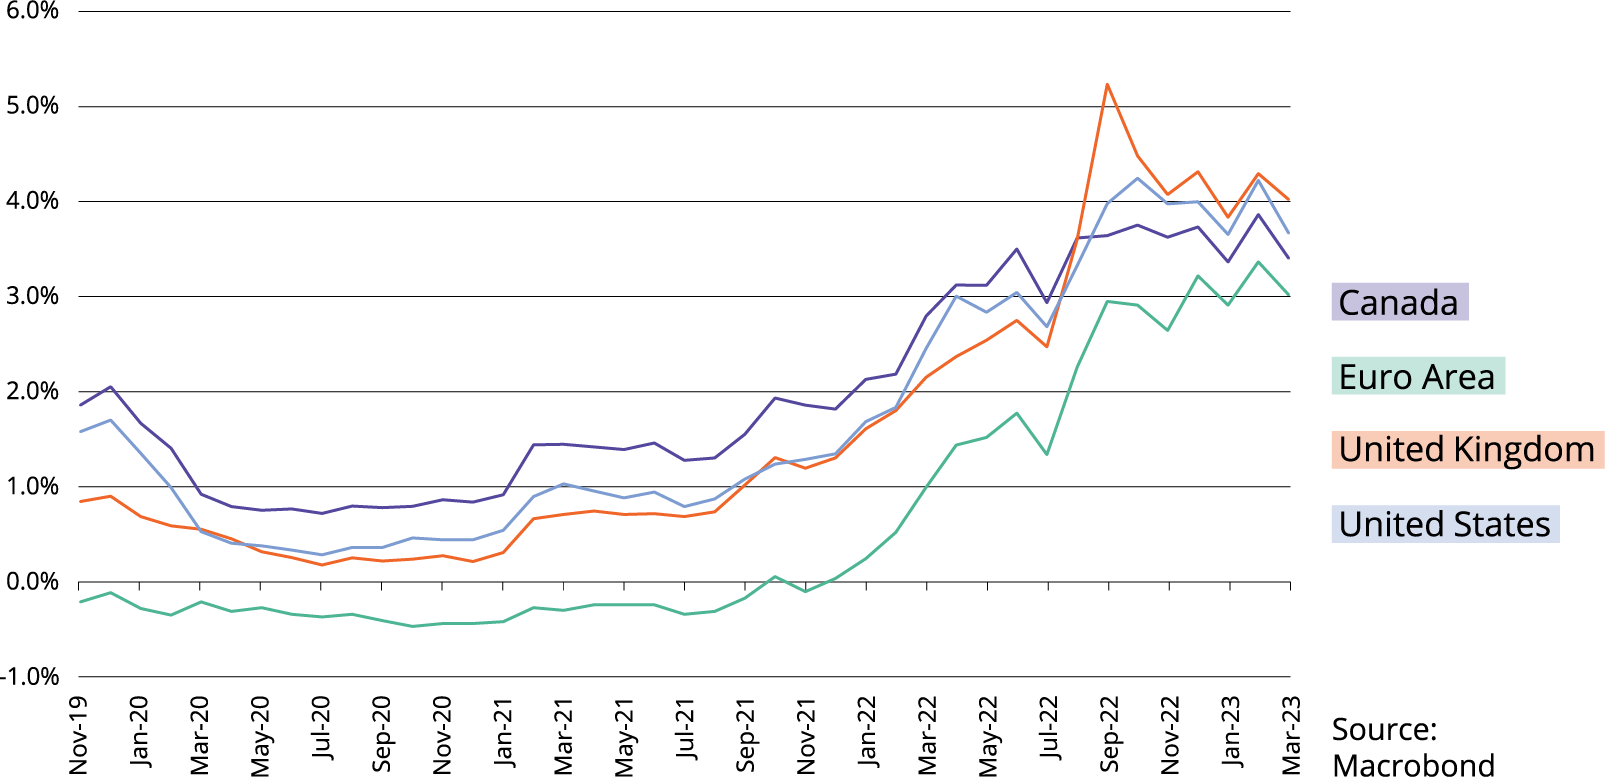
Figur: Interest Rates in Canada, Euro Area, UK, and US (2019–2023)
Beschreibung:
This line chart illustrates the evolution of interest rates in four major economies: Canada, the Euro Area, the United Kingdom, and the United States, from November 2019 to March 2023. Interest rates are plotted as percentages on the vertical axis, while time progresses along the horizontal axis. The United Kingdom experienced the most significant rise, exceeding 4% by late 2022, reflecting a response to inflationary pressures. The Euro Area shows the lowest rates, starting below 0% in 2019 and gradually increasing. The United States and Canada exhibit moderate growth trends, peaking near 3.5–4% during the same period. This chart highlights how global regions have adjusted interest rates in response to economic conditions and inflation.
Wichtige Erkenntnisse:
- The United Kingdom experienced the steepest increase in interest rates, peaking above 4% by late 2022, likely due to higher inflation rates.
- The Euro Area maintained low interest rates, starting below 0% and gradually increasing, reflecting more cautious monetary policies.
- Canada and the United States had similar trends, with rates stabilizing near 3.5–4% by early 2023, signaling efforts to manage inflation.
- The sharp increases in rates during 2022 reflect central bank responses to global economic recovery and inflationary pressures.
- Regional differences highlight variations in monetary policy approaches among the four economies.
Application of Information:
This chart provides valuable insights for real estate investors, financial analysts, and learners seeking to understand how interest rate changes affect borrowing costs and investment decisions. By identifying trends, users can analyze how rising rates may influence mortgage costs, property values, and market demand. It also emphasizes the importance of monitoring central bank policies to anticipate future rate movements and their economic implications.
4A.3 Historical Overview of Interest Rates Globally
Historically, global interest rates have fluctuated due to various economic crises and monetary policies. For instance, after the Global Financial Crisis in 2008, central banks around the world slashed interest rates to stimulate economic activity. In recent years, rising inflation has prompted many countries, including the U.S., to raise rates again, which is expected to affect global real estate markets.
4A.4 The Mortgage Affordability Factor Globally
Mortgage affordability is a crucial consideration for homebuyers and real estate investors worldwide. Rising interest rates make mortgages more expensive, reducing the pool of potential buyers.
In countries like Australien Und Kanada, where home prices are already high, mortgage affordability has become a significant concern as interest rates have risen. Globally, maintaining mortgage payments below 30-35% of household income is generally considered a rule of thumb for affordability.
4A.5 Other Factors to Consider in Global Real Estate Markets
- Technological Advancements
The rise of proptech (property technology) has revolutionized real estate markets worldwide. Technologies such as virtual property tours, online marketplaces, and blockchain for secure transactions are changing how real estate is bought, sold, and managed. - Climate Change and Real Estate
Climate change is increasingly affecting global real estate markets, particularly in coastal cities. Rising sea levels and more frequent extreme weather events are causing property values to fluctuate in areas prone to environmental risk, such as Miami, Venice, and parts of Bangladesh.
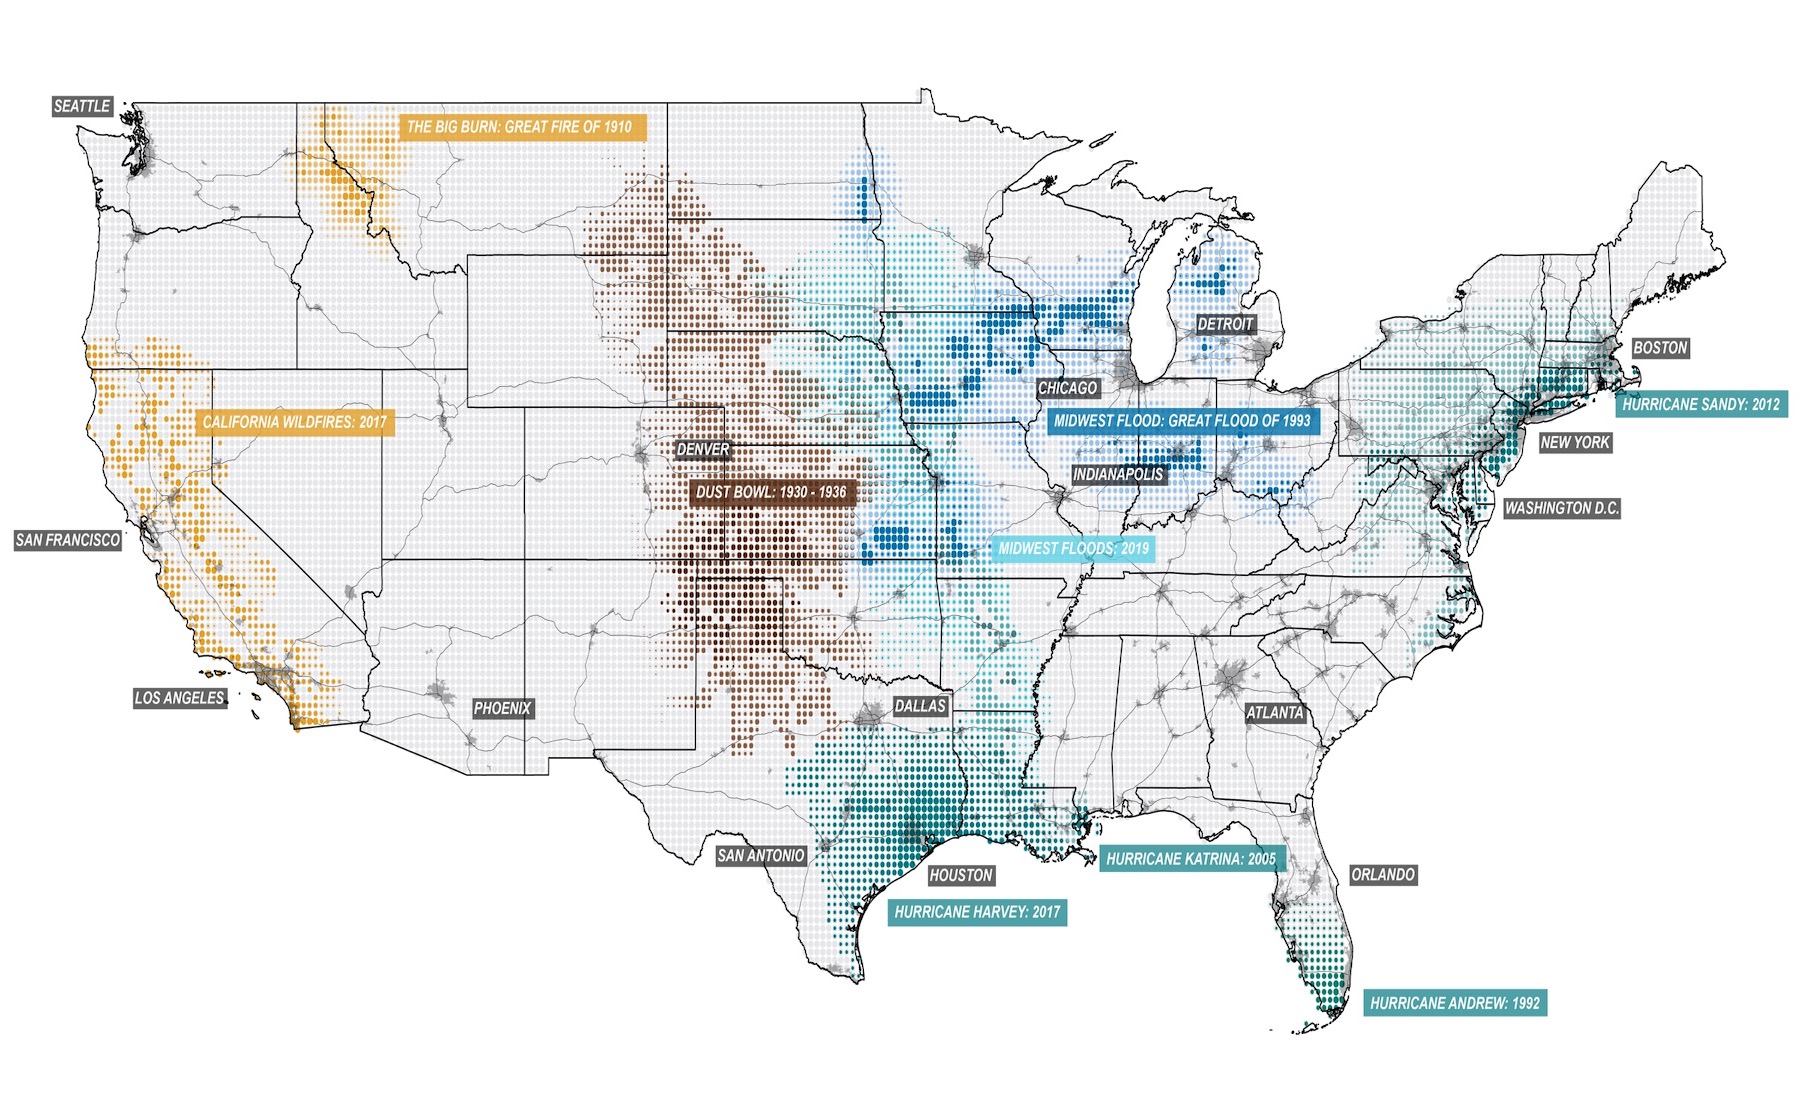
Figur: Mapping Severe Climate Disasters in the U.S.
Beschreibung:
This map visualizes the locations and impacts of severe climate disasters across the United States. Highlighted events include wildfires in California (2017), the Dust Bowl (1930–1936), Hurricane Katrina (2005), Und Midwest floods (1993 and 2019). Each event is marked on the map with corresponding shaded areas or points, representing the geographical extent and severity of the disasters. This visual illustrates the diverse nature of climate risks, such as hurricanes, floods, wildfires, and droughts, emphasizing their widespread impact on different regions.
Wichtige Erkenntnisse:
- Der California wildfires (2017) Und The Big Burn (1910) represent significant wildfire events concentrated in the western U.S., driven by dry conditions.
- Der Dust Bowl (1930–1936) heavily affected central states, demonstrating the catastrophic effects of prolonged drought and poor agricultural practices.
- Hurricanes like Katrina (2005) and Harvey (2017) have impacted Gulf Coast cities such as Houston and New Orleans, causing extensive flooding and damage.
- Der Midwest is prone to floods, such as the Great Flood of 1993 and more recent events in 2019, highlighting vulnerabilities in riverine regions.
- Climate risks are region-specific, but their widespread occurrence underscores the growing importance of preparedness and resilience planning.
Application of Information:
This map is valuable for real estate investors, urban planners, and policy makers in understanding the geographic distribution of climate risks. It aids in making informed decisions on property investment, insurance planning, and infrastructure development. For learners, it illustrates the diverse impacts of climate disasters, emphasizing the need for adaptive strategies to mitigate future risks.
Wichtige Unterrichtsinformationen:
- Economic health is a primary driver of real estate demand, with strong economies typically experiencing increased property demand and value appreciation.
- Supply limitations in urban areas like Hong Kong and New York result in high property prices, whereas markets with excess supply might see price declines.
- Political stability attracts investment, making countries like Canada and Switzerland preferred destinations for real estate capital.
- Rapid population growth in cities such as Mumbai and Mexico City fuels ongoing demand for residential and commercial real estate.
- Interest rate fluctuations play a significant role in real estate affordability and market dynamics, influencing investment decisions globally.
Schlusserklärung
Real estate markets globally are affected by a complex interplay of economic, political, and demographic factors. Understanding these influences is crucial for investors aiming to make informed decisions in diverse international markets.
