
Vergleich von Aktien, aktiven und passiven ETFs
Key Learning Objectives:
Einführung: In this section, we delve into the nuances of choosing between individual stocks, active ETFs, and passive ETFs. You’ll gain insights into how these investment vehicles differ and what factors to consider when building your portfolio.
- Understand the differences in risk and potential returns between individual stocks, active ETFs, and passive ETFs. This knowledge is key to making informed investment choices that align with your goals.
- Learn Wie investment fees and expenses impact your portfolio’s long-term growth. Understanding these costs is crucial for maximizing your investment returns.
- Discover the pros and cons of Buy & Hold Und Active Trading strategies. This understanding will help you choose the approach that best suits your investment style and objectives.
- Explore the benefits of the Dollar Cost Averaging Strategy in minimizing market risks and making consistent investments.
- Grasp the principles of Fundamental Analysis Und Technische Analyse for evaluating stocks. This comprehensive approach enhances your ability to make well-informed investment decisions.
When building a portfolio, investors must choose between individual stocks, active ETFs, and passive ETFs. Each investment vehicle has its pros and cons:
- Individual stocks: Pros include the potential for high returns and direct control over investments. Cons include higher risk, research-intensive selection, and time-consuming management.
- Active ETFs: Pros include professional management, the potential to outperform benchmarks and diversification. Cons include higher fees, reliance on the skill of the fund manager, and potential underperformance.
- Passive ETFs: Pros include low fees, broad market exposure, and ease of investment. Cons include limited potential to outperform the market and exposure to market fluctuations.
19.1 Investment Fees & Expenses
Fees and expenses are essential factors to consider when investing, as they can significantly impact long-term performance. These costs can come in the form of management fees, trading fees, and taxes.
To illustrate the impact of fees, let’s consider an example:
Investor A invests $10,000 in a fund with an annual return of 7% and an expense ratio of 0.5%.
Investor B invests $10,000 in a fund with an annual return of 7% and an expense ratio of 1.5%.
Over 30 years, Investor A’s investment would grow to approximately $74,872, while Investor B’s investment would grow to only $57,435. This difference highlights the importance of considering fees and expenses when choosing investments.
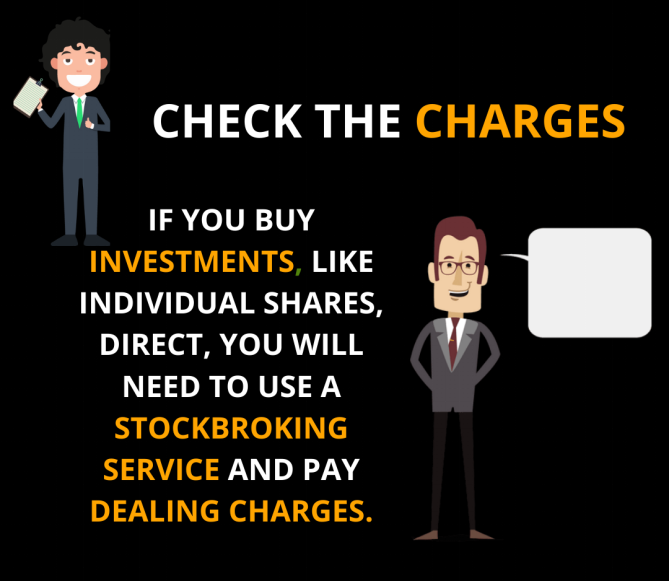
Figure: The infographic highlights the importance of being aware of charges when investing. It specifically mentions that if one buys investments like individual shares directly, they will need to use a stockbroking service and will incur dealing charges.
Source: Custom Infographic
In conclusion, understanding various investment strategies, such as value, growth, and dividend investing, is essential for building a diversified and successful portfolio. By considering factors like risk tolerance, fees, and investment vehicles, investors can develop a plan that meets their long-term financial goals.
19.2 Buy & Hold vs. Active Trading

Figure: A close-up of a hand holding a magnifying glass over a stock market graph. The image symbolizes detailed analysis and scrutiny of stock market trends and data.
Quelle: iStockPhoto
Introduction:
Buy & hold and active trading are two distinct approaches to investing in the stock market. In this section, we’ll introduce both strategies, discuss their pros and cons, and provide examples to illustrate the differences.
Buy & hold:
This strategy involves purchasing stocks and holding them for an extended period, regardless of market fluctuations. Pros include lower trading fees, reduced risk of making emotional decisions, and long-term capital gains tax advantages. Cons include potential missed opportunities for profit and lack of flexibility.
Active trading:
This approach involves buying and selling stocks frequently to capitalize on short-term market trends. Pros include the potential for higher returns and more control over investments. Cons include higher trading fees, increased risk, and the necessity for constant market monitoring.
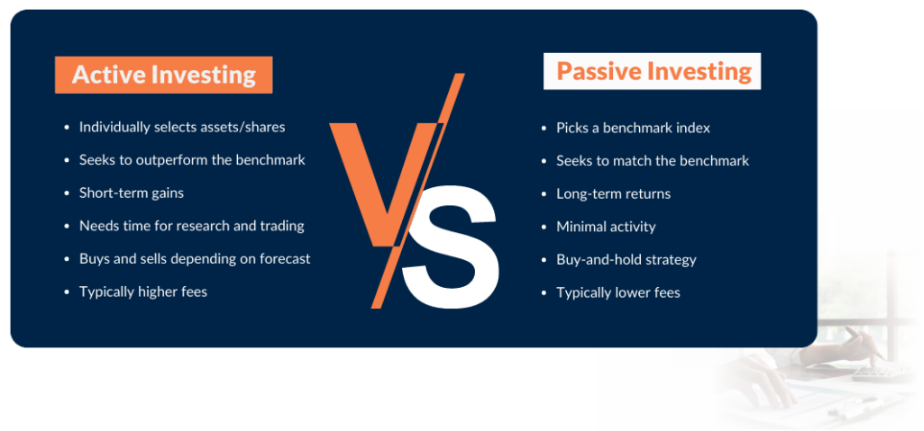
Figure title: Comparing Active vs. Passive Investing Strategies
Quelle: Central Coast Financial Planning Group
Description:
The figure contrasts two investment approaches: Active and Passive Investing. While active investing involves individual asset selection and aims for short-term gains, passive investing focuses on long-term performance by tracking a benchmark like the S&P 500.
Key Takeaways:
- Active Investing: Focuses on outperforming the market and involves more frequent buying and selling, leading to higher fees.
- Passive Investing: Aims to match the market’s performance, usually resulting in fewer transactions and lower fees.
- Risk and Reward: Active investing can yield higher returns but at the cost of higher risk and fees, while passive investing is generally less risky and more cost-effective.
- Time Commitment: Active investing requires significant research and time, whereas passive investing is more hands-off.
Application: Choosing between active and passive investing depends on your financial goals, risk tolerance, and the time you can dedicate to managing your portfolio. Both approaches have their merits and downsides, and understanding them helps you make informed decisions that align with your investment objectives.

Figure title: Active Investing vs. Index Investing: Goals, Mechanics, and Benefits
Quelle: Napkin Finance
Description:
The figure provides a side-by-side comparison of Active Investing and Index Investing, contrasting them across three metrics: goals, mechanics, and key benefits.
Key Takeaways:
- Active Investing: The goal is to beat the market through careful selection of investments, with the key benefit being the potential for above-average returns.
- Index Investing: Aims to match market returns by holding the same investments as the index, with the main advantage being low cost.
- Mechanics: Active investing involves frequent buying and selling to capitalize on opportunities, while index investing is more about “buy and hold.”
- Cost vs. Return: Active investing usually involves higher fees due to frequent trading, whereas index investing is cost-effective.
Application: Knowing the differences between active and index investing can help you align your investment strategy with your financial goals and risk tolerance. Whether you want the opportunity for higher returns or prefer a low-cost, hands-off approach, this comparison helps you make an informed choice.
19.3 Dollar Cost Averaging Strategy

Figure: A close-up of a hand writing on a notepad with the words “Dollar Cost Averaging” highlighted, accompanied by charts and graphs. The image emphasizes the strategic investment approach of dollar-cost averaging.
Source: iStockPhoto
Dollar-cost averaging (DCA) is a popular investment strategy that involves investing a fixed amount of money at regular intervals, regardless of market conditions. This approach can help investors minimize the impact of market volatility and reduce the risk of making poor investment decisions. In this section, we’ll discuss the pros and cons of DCA, provide examples, and explain how to implement this strategy.
Pros: Reduces the impact of market fluctuations, encourages consistent investing, and mitigates the risk of poor market timing.
Cons: Potential for lower returns if markets consistently rise and may not be suitable for investors seeking to capitalize on short-term market movements.
Example: An investor decides to invest $500 per month in an index fund. By using DCA, the investor buys more shares when prices are low and fewer shares when prices are high. Over time, this strategy can help reduce the average cost per share, potentially leading to better long-term returns.
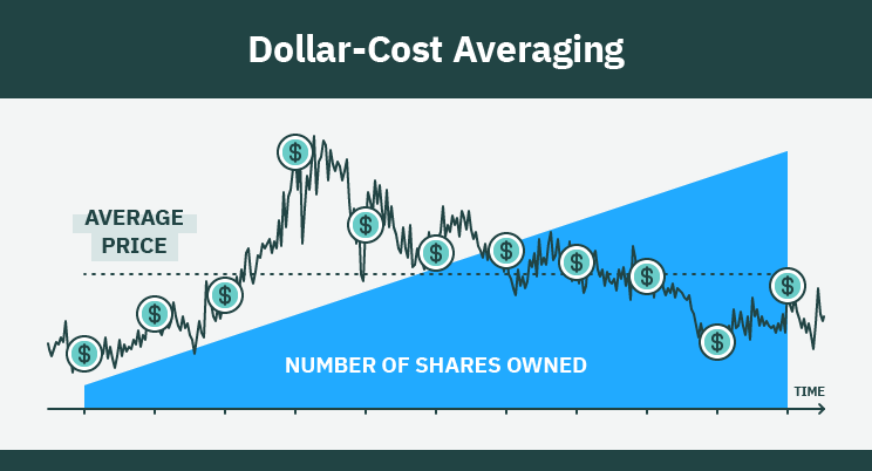
Figure title: Visualizing the Mechanism of Dollar-Cost Averaging
Quelle: Tokenist
Description:
The image illustrates how dollar-cost averaging works by marking purchase points with a circled $ sign. Over time, the investor accumulates more shares, with the average price reflecting a weighted sum of the different purchase prices.
Key Takeaways:
- Consistent Investment: The investor buys shares at regular intervals, regardless of price fluctuations.
- Weighted Average: Over time, the average purchase price will usually be higher than the initial price due to market trends.
- Simplicity: One common method of dollar-cost averaging is to invest a fixed amount at each interval.
Application:
Dollar-cost averaging is a straightforward way to mitigate risk in a volatile market. By consistently investing the same amount over time, you can smooth out the effects of market highs and lows, making it an accessible strategy for investors of all levels.
19.4 Fundamental Analysis: Valuation of Stocks
Fundamental analysis is a method of evaluating a company’s intrinsic value by examining its financial and qualitative factors. In this section, we’ll discuss qualitative and quantitative aspects of fundamental analysis and provide examples for each.
- Qualitative factors: These are non-financial aspects of a company, such as management quality, competitive advantage, and industry growth. Examples of good and bad qualitative factors include a company with a strong brand presence versus a company facing significant regulatory challenges.
- Quantitative factors: These are the financial aspects of a company, such as earnings, cash flow, and balance sheet strength. Examples of good and bad quantitative factors include a company with high-profit margins and low debt versus a company with declining revenues and mounting debt.
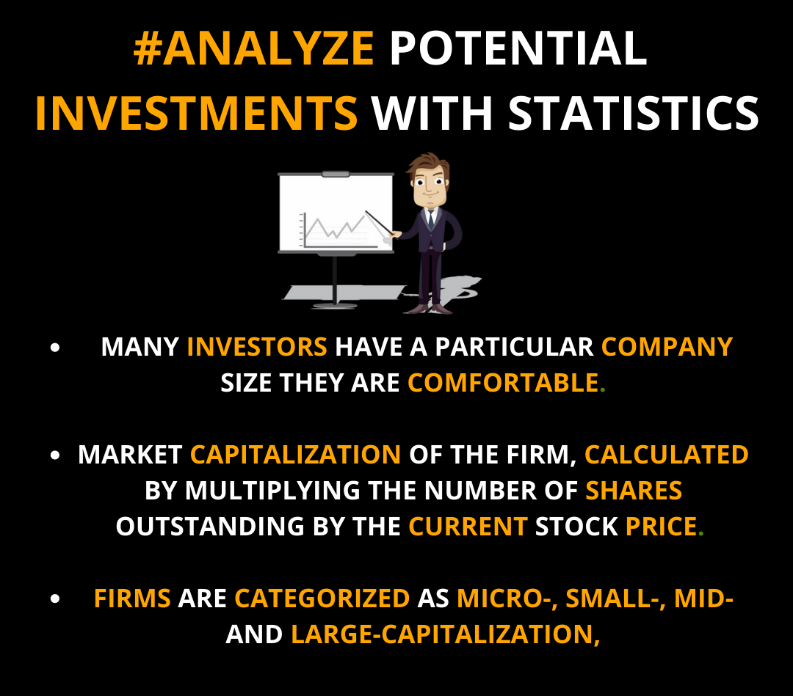
Figure: The infographic emphasizes the importance of analyzing potential investments using statistics. It highlights that many investors have a specific company size they are comfortable with. The market capitalization of a firm is calculated by multiplying the number of shares outstanding by the current stock price. Firms are categorized based on their market capitalization into micro-, small-, mid-, and large-capitalization.
Source: Custom Infographic
- Qualitative factors: These are non-financial aspects of a company, such as management quality, competitive advantage, and industry growth. Examples of good and bad qualitative factors include a company with a strong brand presence versus a company facing significant regulatory challenges.
- Quantitative factors: These are the financial aspects of a company, such as earnings, cash flow, and balance sheet strength. Examples of good and bad quantitative factors include a company with high-profit margins and low debt versus a company with declining revenues and mounting debt.
19.5 Technical Analysis Introduction
![]()
Figure: A close-up of hands interacting with a digital interface displaying various charts, graphs, and connection icons. The image portrays the intricate process of technical analysis in the digital age.
Quelle: iStockPhoto
Technical analysis is a method of evaluating securities by analyzing historical price and volume data. This approach can help investors identify trends and make informed decisions about when to buy or sell stocks. In this section, we’ll provide an overview of technical analysis, discuss key concepts, and explain its application in stock investing.
Key concepts: Support and resistance levels, trendlines, moving averages, and chart patterns.
Application: Technical analysis can be used in conjunction with fundamental analysis to identify attractive entry and exit points for stock investments.
Note: We have a separate, detailed course on technical analysis for those who want to delve deeper into this subject.
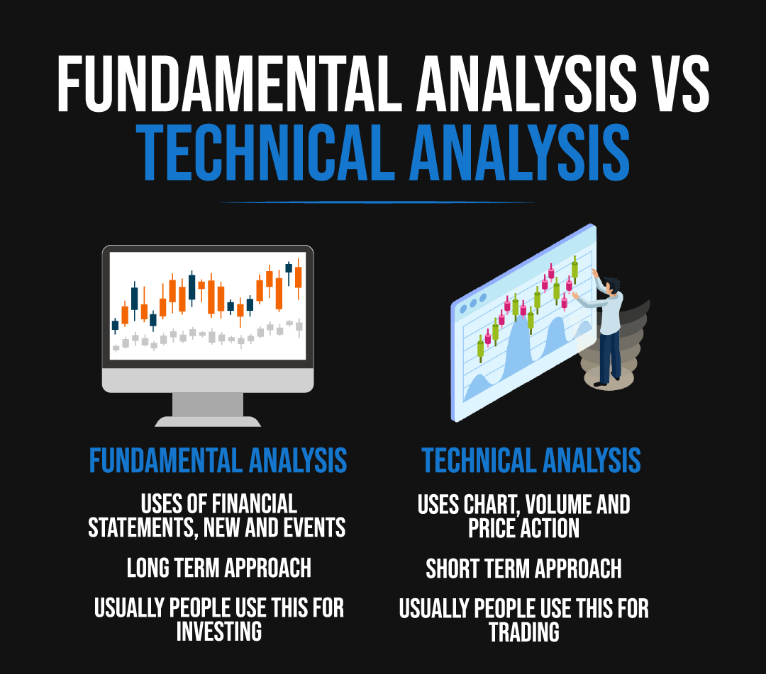
Figure: This infographic contrasts “Fundamental Analysis” with “Technical Analysis.” Fundamental Analysis relies on financial statements, news, and events, and adopts a long-term approach, typically used for investing. On the other hand, Technical Analysis uses charts, volume, and price action, focusing on a short-term approach, and is commonly used for trading
Source: Custom Infographic
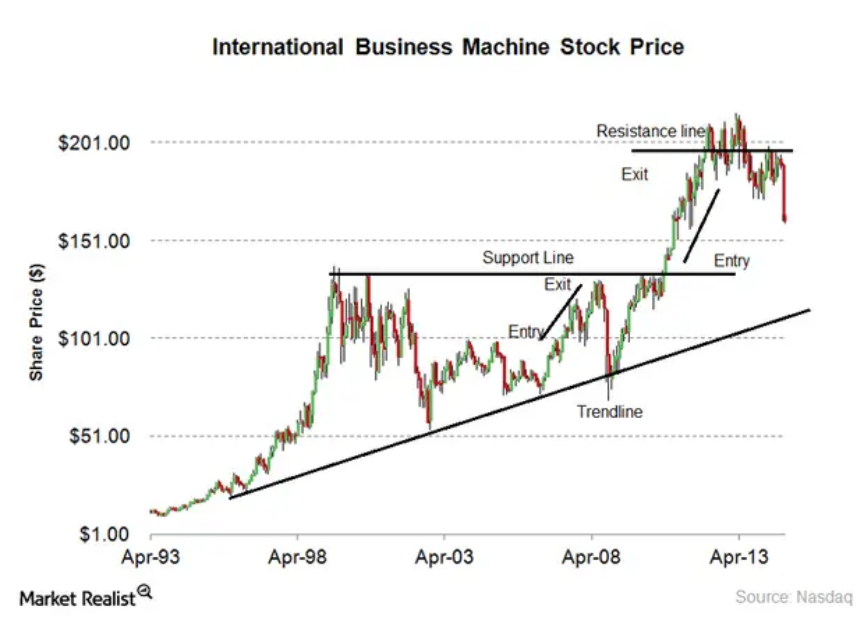
Figure title: Understanding Technical Analysis in Stock Investing
Quelle: Market Realist
Description: The figure provides a visual guide to technical analysis in stock investing. Technical analysis involves studying price movements in the market to forecast future prices. It employs various types of charts, and in this case, it uses candlestick charts, marked by green and red lines, to represent the stock’s price movements. Important concepts like trendlines, support, and resistance lines are also identified.
Key takeaways:
- Candlesticks: The green and red lines are candlesticks, representing stock prices over specific time frames. Green generally means the stock has increased in value, while red means it has decreased.
- Trendlines: These are lines drawn over pivot highs or under pivot lows to show the prevailing direction of price. Trendlines can be upward, downward, or sideways and are crucial in identifying the stock’s trend.
- Support and Resistance Lines: Support is a price level where a downtrend can be expected to pause, due to a concentration of demand. Resistance is a price level where a uptrend can be expected to pause due to a concentration of supply.
Application: Technical analysis is crucial for investors looking to time the market effectively. It can be particularly useful for short-term traders seeking to capitalize on market trends. Identifying support and resistance lines can help investors know when to enter or exit a trade.
Key Takeaways:
Closing Statement: This section equips you with essential knowledge on different investment vehicles and strategies. Understanding these concepts is fundamental to creating a diversified and resilient investment portfolio, tailored to your financial goals.
- The choice between individual stocks, active ETFs, and passive ETFs hinges on balancing risk and return. Each option caters to different investment styles and objectives.
- Lower investment fees and expenses significantly contribute to higher long-term investment growth, emphasizing the importance of cost-effective investing strategies.
- Your decision between Buy & Hold Und Active Trading should reflect your risk tolerance, investment timeline, and engagement level in managing your portfolio.
- The Dollar Cost Averaging Strategy is a pragmatic approach to reducing the impact of market volatility and fostering disciplined, long-term investment habits.
A balanced application of Fundamental Und Technische Analyse is crucial for thorough stock evaluation, aiding in the identification of both financially sound and potentially lucrative investments.