
Παγκόσμια: Οικονομικές καταστάσεις της εταιρείας
Στόχοι Μαθήματος:
- Grasp the concept of οικονομικές αναλογίες and their significance in evaluating various aspects of a company’s operations, including profitability, efficiency, leverage, and liquidity. This foundational knowledge is essential for making informed investment decisions.
- Learn to analyze profitability ratios like Gross Profit Margin and Net Profit Margin, which provide insights into a company’s ability to generate earnings relative to sales and control costs.
- Καταλαβαίνουν solvency ratios, such as the Debt-to-Equity Ratio, to evaluate a company’s long-term financial stability and its ability to meet debt obligations.
- Εξερευνώ liquidity ratios like the Current Ratio and Quick Ratio, which measure a company’s ability to meet short-term obligations and manage cash flows effectively.
- Delve into market prospects ratios such as the Price-to-Earnings (P/E) Ratio, which helps assess investor expectations about a company’s future growth and profitability.
A. Introduction
Analyzing a company’s financial statements is crucial for understanding its financial health, stability, and performance. Investors and analysts rely on various financial ratios to evaluate aspects such as profitability, liquidity, solvency, and market prospects. These ratios offer insights into how effectively a company manages its resources, generates profits, and sustains its operations. This chapter covers the key ratio categories used in financial analysis and explains their significance.
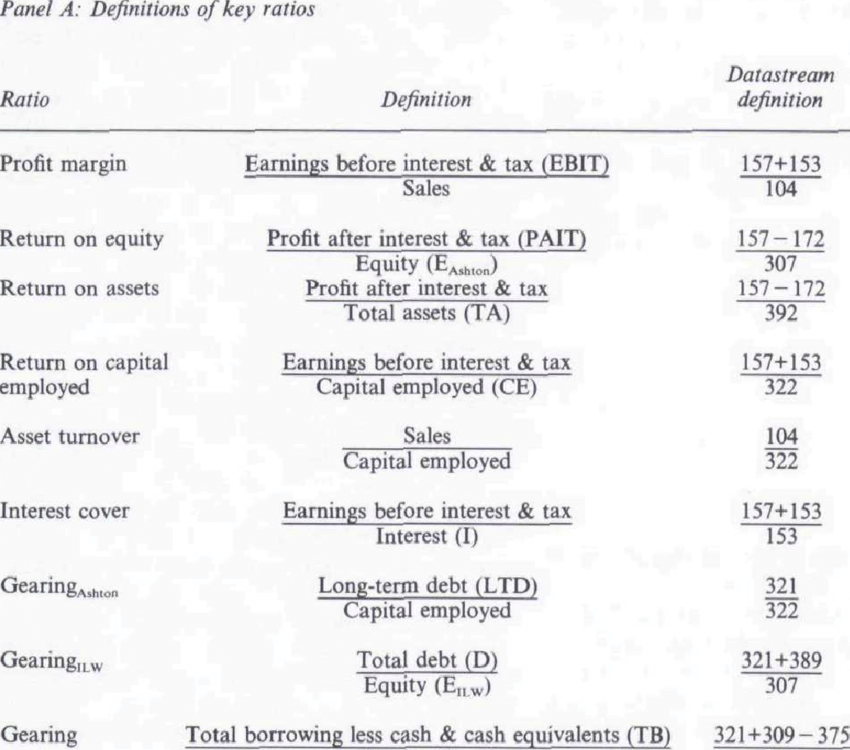
Εικόνα: Definitions of Key Financial Ratios
Περιγραφή:
This table defines various key financial ratios used in financial analysis. Each ratio is described in terms of its calculation and its respective components. For instance, Profit Margin is calculated by dividing Earnings Before Interest & Tax (EBIT) με Sales, ενώ Απόδοση Ιδίων Κεφαλαίων (ROE) is determined by dividing Profit After Interest & Tax (PAIT) με Δικαιοσύνη. Other important ratios include Return on Assets (ROA), Απόδοση Απασχολούμενου Κεφαλαίου (ROCE), Asset Turnover, Interest Cover, and different Gearing ratios, which measure leverage. The table also includes definitions used in the Datastream database for these ratios.
Βασικά συμπεράσματα:
- Profitability Ratios: Profit margin, ROE, and ROA measure a company’s ability to generate profit relative to sales, equity, and total assets, respectively.
- Efficiency Ratios: Asset turnover and return on capital employed assess how effectively a company uses its assets and capital to generate revenue.
- Leverage Ratios: Gearing ratios and interest cover provide insights into the company’s debt levels and its ability to cover interest expenses.
- Datastream Definitions: These are specific codes used to identify the calculations in financial databases.
Εφαρμογή πληροφοριών:
Κατανόηση αυτών key financial ratios is crucial for επενδυτές και αναλυτές to evaluate a company’s οικονομική υγεία, profitability, αποδοτικότητα, και leverage. By comparing these ratios across companies or industries, users can make more informed επενδυτικές αποφάσεις and conduct financial benchmarking.
B. Ratio Categories
Financial ratios are divided into several categories, each focusing on a specific aspect of a company’s financial health. These include profitability ratios, solvency ratios, liquidity ratios, turnover ratios, coverage ratios, και market prospects ratios.
C. Profitability Ratios
Profitability ratios help measure how well a company generates profit from its operations. They assess how efficiently a company converts sales into earnings and manages its costs.
C.1 Gross Profit Margin
ο gross profit margin reflects the percentage of revenue remaining after deducting the cost of goods sold (COGS). It indicates how efficiently a company is producing its products or services.
- Τύπος: Gross Profit Margin = (Revenue – COGS) / Revenue
- A higher gross profit margin suggests better production efficiency and cost control.
C.2 Net Profit Margin
ο net profit margin shows the percentage of revenue left after all expenses, including taxes and interest, have been deducted. It is a key indicator of overall profitability.
- Τύπος: Net Profit Margin = Net Income / Revenue
- A higher net profit margin indicates that the company is effective in managing its expenses.
C.3 Return on Assets (ROA)
Return on assets (ROA) measures how efficiently a company uses its assets to generate profit. It assesses the company’s ability to turn its investments into earnings.
- Τύπος: ROA = Net Income / Total Assets
- A higher ROA suggests that the company is using its assets efficiently to generate earnings.
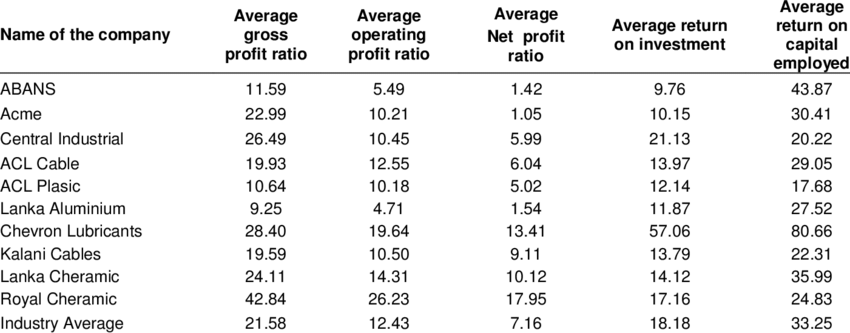
Εικόνα: Average Profitability Ratios of Selected Companies
Περιγραφή:
The table presents the average profitability ratios of different companies, including gross profit ratio, operating profit ratio, net profit ratio, return on investment, και return on capital employed. Each column represents a specific profitability metric, allowing for a comparison of how well these companies perform in terms of generating profits at various levels of financial performance. The final row shows the industry average for each ratio, providing a benchmark against which individual company ratios can be evaluated.
Βασικά συμπεράσματα:
- Gross Profit Ratio: Measures profitability after subtracting the cost of goods sold, indicating how well a company is controlling production costs.
- Operating Profit Ratio: Represents profit after deducting all operational expenses, highlighting efficiency in managing operating costs.
- Net Profit Ratio: Reflects profitability after all expenses, taxes, and costs, offering a comprehensive view of financial performance.
- Return on Investment (ROI): Assesses overall profitability in relation to total investments, showing how well the company generates returns.
- Return on Capital Employed (ROCE): Indicates how effectively a company uses its capital to generate profits, an important metric for assessing business efficiency.
D. Solvency Ratios
Solvency ratios evaluate a company’s ability to meet its long-term obligations. These ratios are used to assess financial leverage and how much debt a company uses relative to its equity.
D.1 Debt-to-Equity Ratio
ο debt-to-equity ratio compares a company’s total debt to its shareholders’ equity. It shows how much debt the company is using to finance its assets relative to its equity.
- Τύπος: Debt-to-Equity Ratio = Total Liabilities / Shareholders’ Equity
- A higher ratio indicates more financial leverage, which can increase risk.
D.2 Debt Ratio
ο δείκτης χρέους measures the proportion of a company’s total assets that are financed by debt. It provides an overview of the company’s financial risk.
- Τύπος: Debt Ratio = Total Liabilities / Total Assets
- A higher debt ratio means the company is more reliant on debt, increasing its financial vulnerability.
E. Liquidity Ratios
Liquidity ratios assess a company’s ability to meet its short-term financial obligations. These ratios measure how easily a company can convert its assets into cash to pay off debts.
E.1 Current Ratio
ο current ratio compares a company’s current assets to its current liabilities, showing its ability to meet short-term obligations.
- Τύπος: Current Ratio = Current Assets / Current Liabilities
- A current ratio greater than 1 indicates that the company has more current assets than liabilities.
E.2 Quick Ratio (Acid-Test Ratio)
ο quick ratio, also called the acid-test ratio, measures a company’s ability to pay off short-term liabilities using its most liquid assets, excluding inventory.
- Τύπος: Quick Ratio = (Current Assets – Inventory) / Current Liabilities
- A higher quick ratio suggests that the company can cover its short-term debts without relying on inventory sales.
F. Turnover Ratios
Turnover ratios help measure how efficiently a company manages its assets to generate sales. These ratios assess how well a company manages its inventory and accounts receivable.
F.1 Inventory Turnover
ο αναλογία κύκλου εργασιών αποθεμάτων measures how often a company sells and replaces its inventory over a specific period.
- Τύπος: Inventory Turnover = COGS / Average Inventory
- A higher turnover ratio indicates efficient inventory management and strong demand for products.
F.2 Accounts Receivable Turnover
ο αναλογία κύκλου εργασιών εισπρακτέων λογαριασμών measures how efficiently a company collects payments from its customers.
- Τύπος: Accounts Receivable Turnover = Net Credit Sales / Average Accounts Receivable
- A higher ratio suggests the company is effective at collecting its receivables promptly.
G. Coverage Ratios
Coverage ratios evaluate a company’s ability to meet its fixed financial obligations, such as interest and dividend payments. These ratios are important for understanding a company’s ability to sustain its debt levels.
G.1 Times Interest Earned (TIE) Ratio
ο times interest earned (TIE) ratio measures how easily a company can cover its interest payments on outstanding debt.
- Τύπος: TIE Ratio = EBIT / Interest Expense
- A higher TIE ratio indicates that the company has sufficient earnings to meet its interest obligations, reducing the risk of default.
G.2 Dividend Coverage Ratio
ο dividend coverage ratio measures a company’s ability to pay dividends to shareholders based on its net income.
- Τύπος: Dividend Coverage Ratio = Net Income / Dividends Paid
- A higher ratio suggests that the company can comfortably cover its dividend payments, which is a positive sign for shareholders.
H. Market Prospects Ratios
Market prospects ratios evaluate how investors perceive a company’s future growth potential. These ratios help compare the company’s stock price relative to its earnings or sales.
H.1 Price-to-Earnings (P/E) Ratio
ο price-to-earnings (P/E) ratio compares a company’s current share price to its earnings per share (EPS). It helps investors determine whether a stock is overvalued or undervalued based on its earnings.
- Τύπος: P/E Ratio = Share Price / Earnings Per Share
- A higher P/E ratio often indicates that investors expect future growth, while a lower ratio could signal undervaluation.
H.2 Price-to-Sales (P/S) Ratio
ο price-to-sales (P/S) ratio compares a company’s stock price to its revenue per share. It provides insight into how much investors are willing to pay for each dollar of the company’s sales.
- Τύπος: P/S Ratio = Share Price / Revenue Per Share
- A higher P/S ratio suggests that investors expect higher future growth in revenue.
συμπέρασμα
By analyzing financial statements using these key ratios, investors can gain valuable insights into a company’s profitability, liquidity, solvency, and market prospects. Whether focusing on profitability ratios to evaluate earnings efficiency, liquidity ratios to assess short-term financial health, or market prospects ratios to gauge growth expectations, these tools provide a comprehensive view of a company’s financial performance. Investors can use this knowledge to make more informed decisions and compare companies across industries.
Βασικές πληροφορίες μαθήματος:
- Profitability Ratios like the Gross Profit Margin and Return on Assets (ROA) highlight how effectively a company converts sales into profits and utilizes its assets, crucial for assessing operational efficiency.
- Solvency Ratios, including the Debt-to-Equity Ratio, provide insights into a company’s financial leverage and risk, indicating its capacity to sustain operations in the long term.
- Liquidity Ratios such as the Current Ratio and Quick Ratio are essential for determining a company’s ability to cover immediate financial responsibilities, reflecting its short-term financial health.
- Turnover Ratios assess how efficiently a company manages its assets to generate sales, with metrics like Inventory Turnover and Accounts Receivable Turnover indicating the effectiveness of inventory management and credit policies.
- Market Prospects Ratios, including the P/E and P/S ratios, offer perspectives on the market’s valuation of a company’s growth prospects, guiding investment strategies based on perceived future performance.
Τελική δήλωση:
Mastering the analysis of financial ratios empowers stakeholders to gauge a company’s financial stability, operational efficiency, and growth potential effectively. This knowledge is crucial for conducting detailed financial analyses, making investment decisions, and evaluating competitive positions in the market.
