
Παγκόσμια: οικονομική ανάλυση
Στόχοι Μαθήματος:
- Learn how to analyze the income statement. Θα καταλάβεις πώς revenue, COGS, gross profit, και καθαρά έσοδα are reported. This helps investors evaluate a company’s profitability and how efficiently it operates its core business activities.
- Understand the components of a balance sheet. This statement provides a snapshot of a company’s ακίνητη περιουσία, υποχρεώσεις, και δικαιοσύνη. Learn how to use this information to assess a company’s financial stability and its ability to meet short- and long-term obligations.
- Explore the cash flow statement. The cash flow statement shows how cash is generated and used in the company’s operations, investments, and financing activities. You will learn how to assess a company’s liquidity and its ability to fund future growth and pay its obligations.
- Learn key financial data points that help evaluate a company’s financial performance. Key metrics such as revenue growth, profit margins, ΑΥΓΟΤΑΡΑΧΟ, και debt-to-equity ratio provide a deeper understanding of a company’s profitability, financial health, and risk.
A. Financial Statements
Financial statements are essential tools that show how a company is performing financially. Each statement provides a different perspective on a company’s operations and financial stability. Investors use these statements to understand how a company makes money, manages its resources, and generates cash.
A.1 Income Statement
ο κατάσταση αποτελεσμάτων, also called the profit and loss statement, details a company’s revenues, costs, and expenses over a certain period, such as a quarter or a year. This statement shows whether the company is profitable by comparing its total income (or revenue) to its total expenses.
- Πρόσοδος: This is the total income a company generates from selling goods or services.
- Cost of Goods Sold (COGS): The direct costs associated with producing the goods or services sold by the company. This can include materials, labor, and production costs.
- Μικτό κέρδος: Revenue minus COGS. Gross profit shows how efficiently a company produces its goods.
- Εξοδα λειτουργίας: These are the costs a company incurs to run its business, such as rent, salaries, and utilities. They don’t include the direct costs of producing goods.
- Καθαρά έσοδα: This is the company’s profit after all expenses, taxes, and interest have been deducted from revenue. It tells investors whether the company is making or losing money.
The income statement is crucial for understanding how a company generates its profits and where it incurs its expenses.

Εικόνα: Excel Sports Income Statement
Περιγραφή:
This figure is a simple income statement for Excel Sports, detailing revenue, έξοδα, gains, losses, και καθαρά έσοδα. The statement starts by showing total revenue, which includes merchandise sales and training revenue. It then subtracts various expenses like procurement costs, wages, rent, interest, transportation, and utilities to calculate total expenses. Next, it adds gains (income from the sale of a van) and subtracts losses (settlement costs of a consumer lawsuit) to derive the net income.
Βασικά συμπεράσματα:
- Total Revenue: Sum of merchandise sales and revenue from training.
- Total Expenses: Includes multiple categories such as procurement costs, wages, and utilities.
- Gains and Losses: Reflects non-operational items like van sales income and lawsuit settlements.
- Net Income Calculation: It is the difference between total revenue plus gains and total expenses plus losses, indicating the company’s profit or loss.
Εφαρμογή πληροφοριών:
This income statement format is useful for understanding οικονομική απόδοση over a specific period. It helps investors and stakeholders analyze business profitability, monitor expense management, and identify sources of gains or losses.
A.2 Balance Sheet
ο ισολογισμός is a snapshot of a company’s financial position at a specific point in time. It details what the company owns (assets), what it owes (liabilities), and what is left over for shareholders (equity). The balance sheet helps investors assess a company’s financial stability and its ability to meet short- and long-term obligations.
- Ακίνητη περιουσία: These are resources owned by the company that have value. Assets are divided into current (short-term) assets like cash and inventory, and non-current (long-term) assets like equipment, real estate, and intellectual property.
- Υποχρεώσεις: This includes any debts or obligations the company owes to others. Liabilities can be current (due within a year), such as accounts payable, or long-term, such as loans or bonds.
- Ίδια Κεφάλαια Μετόχων: This represents the owners’ claim on the company’s assets after all liabilities have been paid. It includes retained earnings (profits reinvested in the company) and capital contributions from shareholders.
The balance sheet helps investors evaluate whether a company has enough assets to cover its debts and how much capital is invested by the shareholders.
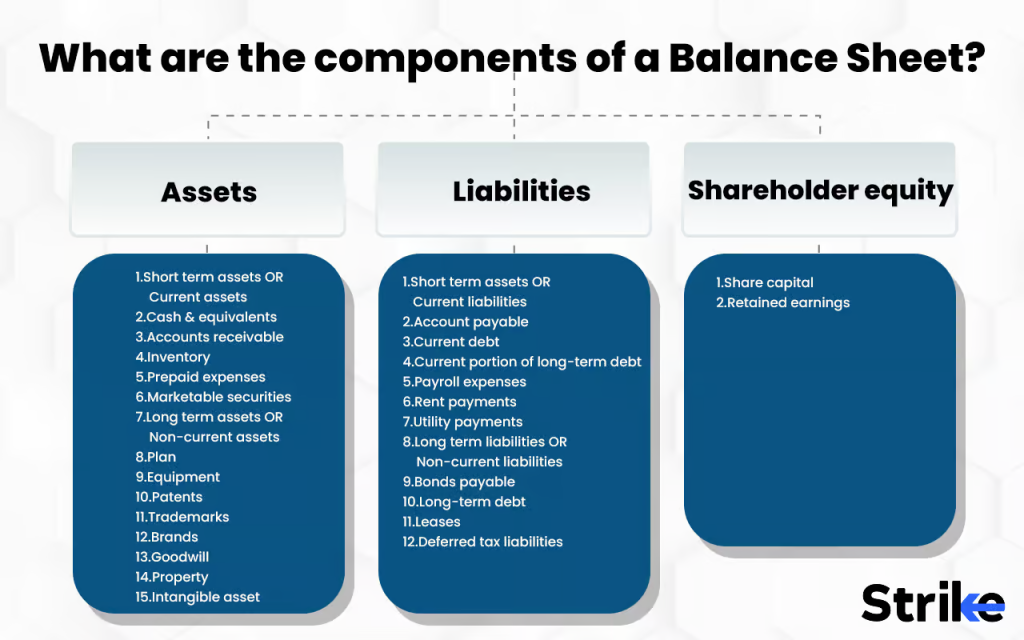
Εικόνα: Components of a Balance Sheet
Περιγραφή:
This figure outlines the three main components of a balance sheet: Ακίνητη περιουσία, Υποχρεώσεις, και Shareholder Equity. The assets section includes both short-term (e.g., cash, inventory) and long-term assets (e.g., equipment, property). The liabilities section covers short-term liabilities (e.g., account payable, current debt) and long-term liabilities (e.g., bonds payable, long-term debt). Lastly, the shareholder equity section comprises share capital και παρακρατημένα κέρδη.
Βασικά συμπεράσματα:
- Ακίνητη περιουσία represent resources owned by the company, divided into short-term (current) and long-term (non-current).
- Υποχρεώσεις represent obligations owed by the company, categorized as short-term (due within a year) or long-term (due after a year).
- Shareholder Equity reflects the owners’ interest in the company, primarily made up of share capital και παρακρατημένα κέρδη.
Εφαρμογή πληροφοριών:
Understanding the components of a balance sheet helps users analyze a company’s οικονομική υγεία. It provides insight into the company’s ακίνητη περιουσία, how it funds those assets (through liabilities or equity), and overall οικονομική σταθερότητα. Investors use this information to assess whether the company has sufficient ακίνητη περιουσία to cover its υποχρεώσεις and generate shareholder value.
A.3 Cash Flow Statement
ο κατάσταση ταμειακών ροών tracks the movement of cash in and out of the company over a specific period. It provides insight into how well a company generates cash to fund its operations, invest in growth, and meet financial obligations. Unlike the income statement, which shows earnings on paper, the cash flow statement shows the actual cash available to the company.
- Λειτουργικές Δραστηριότητες: This section shows the cash a company generates from its core business activities, such as sales and services, minus operational expenses.
- Επενδυτικές Δραστηριότητες: This includes cash spent on investments in long-term assets like real estate, equipment, or acquisitions. It also covers proceeds from the sale of these assets.
- Χρηματοδοτικές δραστηριότητες: This reflects cash flows related to borrowing, repaying debt, issuing shares, or paying dividends to shareholders.
The cash flow statement helps investors understand whether a company has sufficient cash to sustain operations, repay debts, and finance future growth.
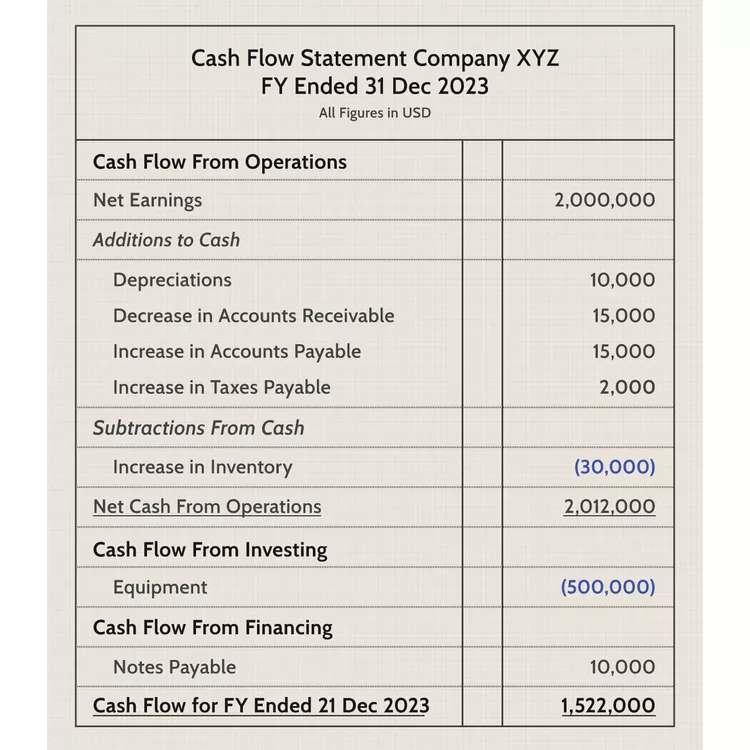
Εικόνα: Cash Flow Statement Company XYZ FY Ended 31 Dec 2023
Περιγραφή:
This figure presents a κατάσταση ταμειακών ροών for Company XYZ for the fiscal year ending on 31 Dec 2023. It details cash inflows and outflows from three primary activities: λειτουργικός, επένδυση, και χρηματοδότηση. The statement starts with net earnings from operations and lists additional cash inflows like υποτίμηση and changes in accounts receivable/payable. It also shows outflows, such as increased inventory. The cash flow from investing includes a significant outflow for equipment purchase, while the financing section includes a small inflow from notes payable. The net result is a total cash flow του $1,522,000 for the year.
Βασικά συμπεράσματα:
- Operating activities show cash generated from core business operations, with net earnings adjusted for non-cash items like υποτίμηση.
- Investing activities highlight cash spent on equipment, indicating capital expenditures.
- Financing activities detail changes in debt or equity, here shown as cash from notes payable.
- Final cash flow represents total cash available at the end of the fiscal year.
Εφαρμογή πληροφοριών:
Understanding a κατάσταση ταμειακών ροών is crucial for analyzing a company’s ρευστότητα, evaluating how well it generates cash to meet obligations, fund operations, and support growth. Investors can use this information to assess a company’s οικονομική σταθερότητα and cash management efficiency.
συμπέρασμα
Each financial statement provides unique insights into a company’s financial health. The κατάσταση αποτελεσμάτων shows whether the company is profitable, the ισολογισμός gives a snapshot of financial stability, and the κατάσταση ταμειακών ροών reveals how well the company manages its cash. Together, these statements offer a comprehensive view of a company’s performance, helping investors make informed decisions about its financial strength and long-term viability.
B. Key Financial Data Points
Beyond understanding financial statements, investors also look at specific data points that highlight a company’s financial performance. These metrics allow investors to evaluate aspects like profitability, liquidity, and financial leverage.
B.1 Introduction to Key Financial Data Points
When analyzing a company’s financial health, several metrics stand out as essential indicators. These data points are derived from the financial statements and offer a more detailed look at a company’s operations.
- Revenue Growth: This measures the rate at which a company’s sales are increasing or decreasing over time. Consistent revenue growth indicates that the company is expanding its market share or successfully introducing new products.
- Profit Margins: Profit margin is a ratio that compares net income to total revenue. It shows how much profit the company makes for every dollar of sales. Higher profit margins typically indicate a company is managing its costs well.
- Απόδοση Ιδίων Κεφαλαίων (ROE): ROE measures how effectively a company is using its shareholders’ equity to generate profits. It’s calculated by dividing net income by shareholders’ equity. A higher ROE suggests that the company is efficiently using its investors’ funds to create returns.
- Δείκτης χρέους προς ίδια κεφάλαια: This ratio compares a company’s total debt to its shareholders’ equity. It’s used to evaluate how much leverage (or debt) a company is using to finance its operations. A high debt-to-equity ratio could signal that the company is heavily reliant on borrowing, which can be risky if earnings are unstable.
B.2 Analyzing Companies' Financial Statements
Investors use financial statements to analyze key metrics and gain insight into a company’s strengths and weaknesses.
- Revenue Trends: By examining the income statement, investors can track a company’s revenue growth over several quarters or years. Declining revenues might signal a competitive challenge or operational issue, while increasing revenues suggest successful strategies.
- Κερδοφορία: Investors assess a company’s ability to convert sales into profits by looking at profit margins and net income. Higher profit margins generally indicate better cost management and pricing power.
- Ρευστότητα: The balance sheet helps investors gauge whether a company can meet its short-term obligations by comparing current assets to current liabilities. This is measured by liquidity ratios like the current ratio ή quick ratio.
- Cash Flow Health: The cash flow statement is essential for understanding whether a company generates enough cash from operations to reinvest in the business, pay off debt, or return value to shareholders through dividends or share buybacks.
By combining the insights from financial statements with key financial data points, investors can build a comprehensive picture of a company’s financial health and growth potential.
συμπέρασμα
Mastering the understanding of financial statements και key financial data points is critical for evaluating a company’s financial health. The income statement, balance sheet, and cash flow statement each offer a unique view of a company’s performance. Analyzing these documents alongside key metrics like revenue growth, profit margins, και debt-to-equity ratios provides a holistic understanding of the company’s strengths, risks, and growth potential. Armed with this knowledge, investors can make informed decisions that align with their financial goals.
Βασικές πληροφορίες μαθήματος:
- The income statement shows a company’s ability to generate profits. It starts with revenue, subtracts COGS, and gives gross profit. Operating expenses are then subtracted to determine καθαρά έσοδα. By analyzing these numbers, investors can assess how well a company is managing its costs and achieving profitability.
- Ο ισολογισμός προσφέρει μια συνοπτική εικόνα της οικονομικής θέσης μιας εταιρείας. It categorizes ακίνητη περιουσία into current and non-current, helping investors assess liquidity. The υποχρεώσεις section shows the company’s debts, while shareholder equity reflects the ownership interest in the company. This helps investors understand the company’s ability to meet its obligations.
- The cash flow statement highlights cash generation and usage. This statement tracks cash from λειτουργικός, επένδυση, και χρηματοδότηση activities. Positive cash flow from operations is a good indicator that a company can sustain its core business and invest in growth. The statement also helps assess how much cash the company has to pay off debts and return to shareholders.
- Revenue growth shows a company’s market expansion. By tracking revenue trends over time, investors can identify whether a company is gaining market share, introducing successful products, or facing challenges. Profit margins indicate how well a company manages its costs, with higher margins reflecting better cost management.
Τελική δήλωση:
By analyzing a company’s κατάσταση αποτελεσμάτων, ισολογισμός, και κατάσταση ταμειακών ροών, investors gain valuable insights into its profitability, financial health, and liquidity. Understanding key financial metrics like revenue growth, ΑΥΓΟΤΑΡΑΧΟ, και debt-to-equity ratio enhances your ability to evaluate a company’s performance and make informed investment decisions.
