
Παγκόσμια: Τέλη και Έξοδα Επενδύσεων
Στόχοι Μαθήματος:
- Understand the Impact of Investment Fees and Expenses: Learn how transaction fees και management expenses (for active vs. παθητικά ETF) can affect the overall returns of your investments. Understand the cost implications of both stock investing and ETF management strategies.
- Explore Buy & Hold vs. Active Trading: Compare the buy-and-hold strategy for long-term growth versus the active trading strategy for short-term gains. Understand the advantages and disadvantages of both approaches, including transaction costs, φορολογικές επιπτώσεις, και emotional decision-making.
- Learn About Dollar-Cost Averaging: Understand the dollar-cost averaging (DCA) strategy, which helps mitigate the impact of market volatility. This approach is useful for both passive and active investors seeking to enter the market gradually over time.
- Fundamental and Technical Analysis: Understand the difference between θεμελιώδης ανάλυση (evaluating company financials) and τεχνική ανάλυση (using price patterns and market trends) to make investment decisions. Learn how both methods can complement each other in crafting an investment strategy.
A. Investment Fees & Expenses
One of the most significant factors to consider when comparing stocks and ETFs (both active and passive) is the cost.
- Αποθέματα: When investing in individual stocks, you typically pay transaction fees for buying and selling. However, once you own the stock, there are no ongoing management fees, unless you’re using a managed account.
- Ενεργά ETF: Active ETFs are managed by professionals who make investment decisions on behalf of investors, attempting to outperform the market. These funds typically have higher management fees, called expense ratios, due to the active management and frequent trading involved.
- Παθητικά ETF: Passive ETFs track a specific index, such as the S&P 500 ή FTSE 100, and are not actively managed. As a result, they have lower expense ratios compared to active ETFs, making them a cost-effective option for investors seeking broad market exposure.
B. Buy & Hold vs. Active Trading
Investment strategies vary significantly between buy-and-hold investors και active traders, especially when comparing stocks with active and passive ETFs.
- Buy & Hold (Passive Strategy): This strategy involves purchasing investments with the intention of holding them for the long term, regardless of short-term market fluctuations. This approach is popular with passive ETF investors and those who purchase individual stocks of stable companies. The goal is to benefit from long-term growth and compounding returns.
- Πλεονεκτήματα: Lower transaction costs, fewer taxes on capital gains, and reduced emotional decision-making.
- Μειονεκτήματα: Potential for missed opportunities during short-term market trends.
- Πλεονεκτήματα: Lower transaction costs, fewer taxes on capital gains, and reduced emotional decision-making.
- Active Trading (Active Strategy): Active trading involves frequent buying and selling of securities to capitalize on short-term market movements. Active ETF managers and individual traders use this strategy to outperform market indices, but it requires constant monitoring and a higher level of market expertise.
- Πλεονεκτήματα: Potential for higher returns if market timing is successful.
- Μειονεκτήματα: Higher transaction costs, greater tax liabilities, and increased risk from short-term market volatility.
- Πλεονεκτήματα: Potential for higher returns if market timing is successful.
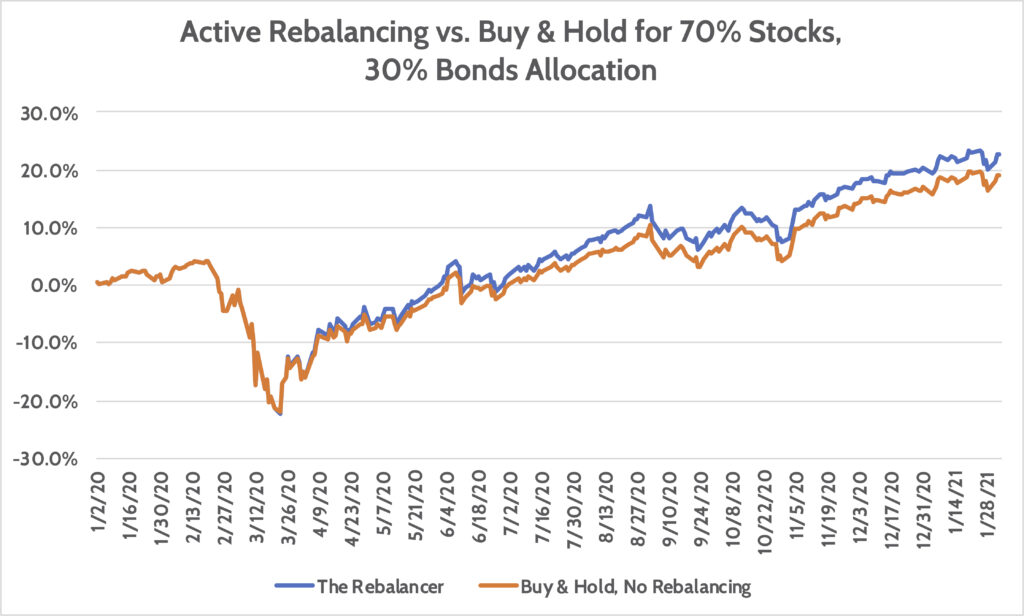
Εικόνα: Active Rebalancing vs. Buy & Hold for 70% Stocks, 30% Bonds Allocation
Περιγραφή:
This line chart compares the performance of active rebalancing versus a buy-and-hold strategy with a 70% stocks and 30% bonds allocation over a period spanning from January 2, 2020, to January 28, 2021. The blue line represents “The Rebalancer,” which indicates active rebalancing of the portfolio, while the orange line represents “Buy & Hold, No Rebalancing,” showing a static portfolio strategy. Throughout the observed period, the rebalanced portfolio shows a slight edge in performance, especially during volatile phases such as the March 2020 market downturn. Over time, the active rebalancer demonstrates a consistently higher return compared to the buy-and-hold approach, particularly noticeable from mid-2020 onwards.
Βασικά συμπεράσματα:
- Active rebalancing tends to yield higher returns compared to the buy-and-hold strategy, especially during volatile market conditions.
- ο March 2020 market downturn demonstrates the value of active rebalancing, as the strategy recovers more effectively.
- By the end of the period, the actively rebalanced portfolio maintains a higher total return than the buy-and-hold strategy.
- The gap between the two strategies increases over time, highlighting the potential benefits of rebalancing in a diversified portfolio.
Εφαρμογή πληροφοριών:
This comparison illustrates the potential advantages of implementing an active rebalancing strategy for investors aiming to maintain their desired asset allocation and enhance returns. By regularly adjusting the portfolio, investors can mitigate risks during market volatility and potentially improve their overall returns. Understanding this concept can help investors decide whether to adopt a rebalancing approach in their long-term investment strategies, balancing κίνδυνος και ΕΠΙΣΤΡΟΦΗ more effectively.
C. Dollar-Cost Averaging Strategy
Μέσος όρος κόστους δολαρίου (DCA) is a popular investment strategy that involves investing a fixed amount of money into a particular stock, ETF, or other asset at regular intervals, regardless of its price. This strategy works well for both stocks and ETFs (active and passive) and helps investors mitigate the risks of market volatility.
- How it works: By investing the same amount regularly, investors buy more shares when prices are low and fewer shares when prices are high, effectively lowering the average cost per share over time.
- Εφαρμογή: DCA is particularly effective in παθητικά ETF, where investors are looking for long-term, steady growth. It can also be applied to αποθέματα και ενεργά ETF but may yield less predictable results due to market fluctuations and the higher volatility associated with active management.

Εικόνα: Dollar Cost Averaging vs. Lump Sum Investing
Περιγραφή:
This line chart compares the outcomes of Dollar Cost Averaging (DCA) και Lump Sum Investing using hypothetical portfolio values based on an initial $100,000 investment in the S&P 500 from 2000 to 2024. The orange line shows the performance of a lump sum investment, while the black line represents dollar cost averaging, where equivalent monthly investments are made. The blue shaded area illustrates the difference in value between the two strategies. By 2024, the lump sum investment reaches around $370k, ενώ DCA ends at approximately $342k.
Βασικά συμπεράσματα:
- Lump sum investing generally achieves higher returns over time compared to Dollar Cost Averaging.
- The gap between the two strategies widens over the long term, with lump sum benefiting more during sustained bull markets.
- Both strategies are impacted by market downturns, but DCA shows less volatility during bear markets.
- ο difference in returns between the two strategies is most evident during prolonged bull markets, where lump sum investing capitalizes more on early market gains.
Εφαρμογή πληροφοριών:
Investors can use this comparison to understand the potential benefits and risks of both Dollar Cost Averaging και Lump Sum Investing. While lump sum investing might yield higher returns over time, it also involves greater initial risk. DCA is useful for those looking to minimize risk and gradually enter the market, making it a good choice during periods of uncertainty. Understanding these strategies helps investors align their investment approach with their ανοχή ρίσκου και market outlook.
D. Fundamental Analysis: Valuation of Stocks
Fundamental analysis involves evaluating a company’s financial health to determine whether its stock is undervalued or overvalued. This type of analysis is primarily used for επενδύσεις μετοχών, but it can also inform decisions regarding active ETFs, especially those focused on individual sectors or industries.
Key components of fundamental analysis:
- Δείκτης Τιμής προς Κέρδη (P/E): Compares a company’s current share price to its earnings per share. A low P/E ratio may indicate that a stock is undervalued.
- Δείκτης Τιμής προς Λογιστική (P/B): Measures a company’s market value relative to its book value. A lower ratio can signal a potential buying opportunity.
- Μερισματική απόδοση: Indicates the income generated by a stock relative to its price. Higher yields are attractive to income-focused investors.
Fundamental analysis allows stock investors to assess whether a company is a good long-term investment based on its financial metrics, industry position, and growth potential.
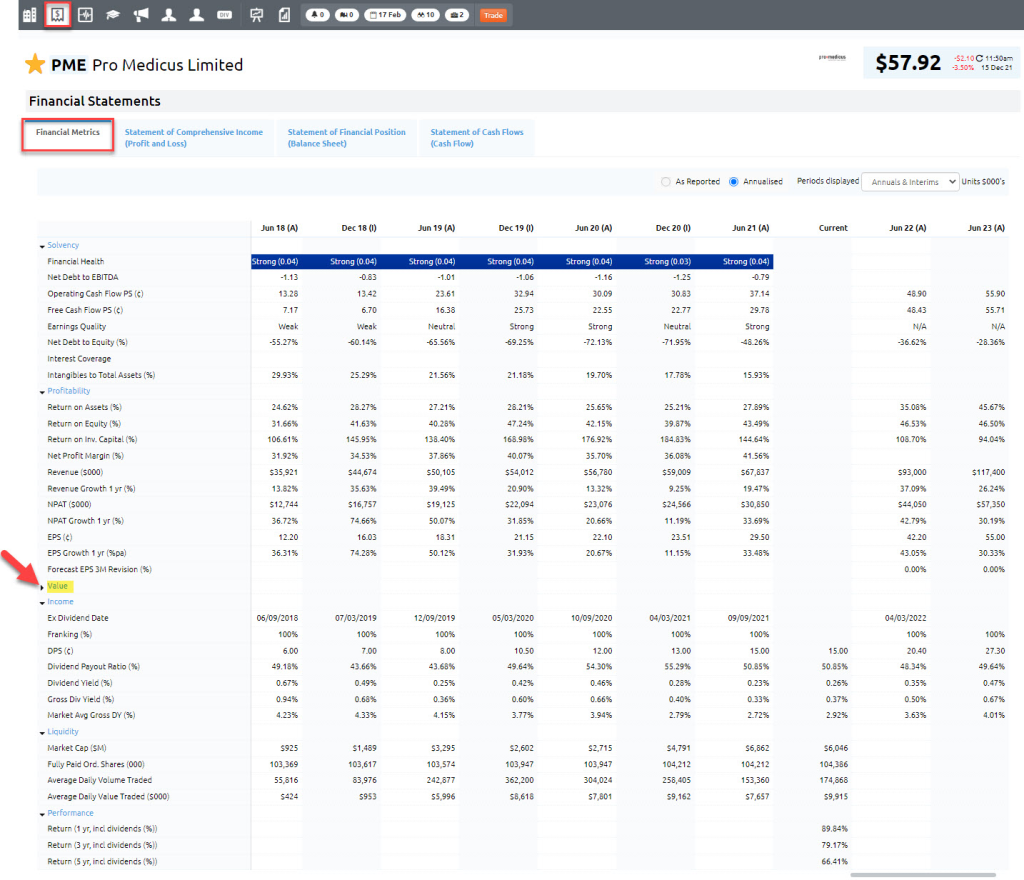
Εικόνα: PME Pro Medicus Limited – Financial Metrics Overview
Περιγραφή:
The image displays the financial metrics table for PME Pro Medicus Limited, highlighting various performance indicators over several reporting periods, including annual and semi-annual data. Metrics include key financial ratios, profitability, returns, and earnings metrics. The table is segmented into sections like οικονομική υγεία, profitability, return on assets/equity, EPS growth, dividend payout ratio, and more, helping users assess the company’s financial performance over time. A red arrow points to the revenue section, emphasizing its importance in evaluating business growth.
Βασικά συμπεράσματα:
- The table provides a comprehensive view of PME’s financial performance across multiple years, facilitating trend analysis.
- Metrics such as ROA, ΑΥΓΟΤΑΡΑΧΟ, EPS growth, και μερίσματα offer insights into profitability, returns, και shareholder value.
- Consistent monitoring of financial metrics can help users understand οικονομική σταθερότητα and predict potential growth or risks.
- The highlighted revenue metric is crucial for analyzing sales trends and business expansion.
Εφαρμογή πληροφοριών:
Investors can use this financial metrics table to perform θεμελιώδης ανάλυση on PME Pro Medicus Limited. By examining historical trends, users can assess the company’s οικονομική υγεία, profitability, και earnings growth over time. This analysis helps in making informed investment decisions, understanding dividend sustainability, and projecting future earnings potential.
E. Technical Analysis Introduction
Technical analysis focuses on studying historical price movements and market trends to make investment decisions. This method is often used by active traders και active ETF managers who aim to take advantage of short-term price movements. Technical analysis involves examining charts, patterns, και indicators to predict future price movements.
Key tools in technical analysis:
- Κινούμενοι μέσοι όροι: The average price of a stock or ETF over a specific period, used to identify trends and potential entry or exit points.
- Relative Strength Index (RSI): A momentum indicator that measures the speed and change of price movements to determine whether an asset is overbought or oversold.
- Επίπεδα Υποστήριξης και Αντίστασης: Price levels where a stock or ETF tends to encounter buying (support) or selling (resistance), which can signal potential turning points in the market.
While technical analysis is more commonly used in active trading, it can also complement fundamental analysis for long-term investors looking to time their entry and exit points.
:max_bytes(150000):strip_icc():format(webp)/dotdash_Final_Support_and_Resistance_Basics_Aug_2020-04-c728025c35b2472f85ba1f09cf79b32d.jpg)
Εικόνα: Support and Resistance with 15-Day Moving Average
Περιγραφή:
This chart illustrates how a 15-day moving average acts as both υποστήριξη και resistance in a stock’s price movement. In an uptrend, the moving average serves as a support level, meaning the stock price tends to bounce off the line as it rises. In a downtrend, the same moving average becomes a resistance level, preventing the stock price from moving higher. Arrows on the chart indicate where the moving average either supports or resists the price action.
Βασικά συμπεράσματα:
- ο 15-day moving average is a popular tool to identify υποστήριξη και resistance levels.
- It acts as a support level in an uptrend, helping prices maintain their upward momentum.
- Conversely, it becomes a resistance level during a downtrend, hindering price increases.
- Using moving averages can help traders identify potential entry και exit points in trades.
Εφαρμογή πληροφοριών:
Traders can use the 15-day moving average as a tool for trend analysis and identifying support and resistance levels. It helps in making buying decisions when the price is near the support in an uptrend and selling decisions when the price meets resistance in a downtrend. Understanding these levels can assist investors in managing their κίνδυνος and planning trade strategies.
συμπέρασμα
When comparing αποθέματα, ενεργά ETF, και παθητικά ETF, investors must consider factors such as investment fees, strategy (buy-and-hold vs. active trading), and their approach to analysis. Each option offers different opportunities and risks, depending on an investor’s financial goals and risk tolerance. For those looking to minimize costs and take a long-term approach, παθητικά ETF και buy-and-hold strategies may be ideal. In contrast, active trading με αποθέματα ή ενεργά ETF can offer higher returns but requires more frequent monitoring and a higher level of expertise. Ultimately, a combination of fundamental και τεχνική ανάλυση, paired with strategies like δολάριο-κόστος κατά μέσο όρο, can help investors make informed decisions across different asset types.
Βασικές πληροφορίες μαθήματος:
- Investment fees significantly impact your returns, with ενεργά ETF generally having higher management fees due to professional management, while παθητικά ETF offer lower fees due to their simple, index-tracking nature. Αποθέματα typically involve transaction fees but no ongoing management fees once purchased.
- ο buy-and-hold strategy is suitable for investors seeking long-term growth, with lower transaction costs and reduced tax liabilities. However, active trading offers the potential for higher short-term returns but comes with υψηλότερο κόστος, greater tax implications, και increased risk due to constant market monitoring.
- Μέσος όρος κόστους δολαρίου (DCA) allows investors to reduce the impact of market volatility by regularly investing a fixed amount, regardless of market conditions. This strategy can smooth out the purchase price over time and is especially useful for long-term growth through παθητικά ETF.
- Fundamental analysis involves assessing a company’s οικονομική υγεία through metrics like the Δείκτης P/E, Λόγος P/B, και μερισματική απόδοση to determine if a stock is υποτιμημένος ή overvalued. Technical analysis, on the other hand, focuses on price movements και τάσεις της αγοράς using tools like κινούμενοι μέσοι όροι και RSI to predict future price movements.
Τελική δήλωση:
By understanding the key investment strategies and techniques covered in this section, investors can make informed decisions about their portfolios, align their approach with their financial goals, and manage risks effectively. Whether you’re interested in long-term growth, income generation, ή short-term gains, these concepts will guide you toward creating a successful trading plan.
