
Local (European-Specific) Content : The Housing Market Cycle in Europe
Στόχοι Μαθήματος:
- Understand the European Housing Market Cycle: You will learn about the four key phases—Ανάκτηση, Επέκταση, Hyper-Supply, και Υφεση—and how they shape property markets in cities across Europe.
- Recognize Market Signals: You’ll be able to identify key signs such as rising property prices, vacancy rates, και construction levels to determine what phase the market is in.
- Learn from Real Examples: Countries like Ισπανία, Ireland, Γερμανία, και Ελλάδα offer lessons on how housing markets react to economic shifts, and how investors responded.
- Apply Investment Tips per Phase: You’ll gain practical knowledge on how to adjust your investment strategy based on the market phase, including tips on buying, selling, and managing risk.
- Use Economic Data for Decision Making: Learn how to analyze figures and graphs—like GDP growth charts and house price indexes—to make better property investment decisions.
21.1 The Housing Market Cycle in Europe
Real estate markets in Europe also follow cyclical patterns that influence property values, rental demand, and investor behavior. European markets are shaped by unique factors such as local regulations, economic policies, and cross-border investment flows. Understanding the housing market cycle in European countries allows investors to make better-informed decisions and adjust strategies accordingly.
Phases of the European Housing Market Cycle:
- Recovery Phase: The market begins to stabilize post-recession, with improving economic indicators such as employment rates.
- Φάση επέκτασης: Strong demand, rising property values, and increased construction characterize this phase.
- Hyper-Supply Phase: As supply outpaces demand, vacancy rates increase, leading to slower price growth.
- Φάση ύφεσης: Declining property values and a reduction in demand for new developments mark this phase.
21.2 Recovery Phase in Europe
The recovery phase occurs after a recession when the housing market starts to show signs of improvement, but investor confidence is still rebuilding. Key European markets such as Ισπανία και Ελλάδα have seen recovery phases following their financial crises.
Key Characteristics of the Recovery Phase:
- Property Prices: Slowly increasing but still below peak levels.
- Vacancy Rates: High but starting to decline as economic conditions improve.
- Construction: Limited new development as demand picks up gradually.
- Investor Sentiment: Cautious optimism, with long-term investors focusing on undervalued properties.
Tips for European Investors During the Recovery Phase:
- Buy at a Discount: Investors can take advantage of lower property prices during the recovery phase in countries like Πορτογαλία ή Ιταλία, where economic recovery is underway.
- Long-Term Vision: Focus on properties with long-term appreciation potential in recovering markets like Ireland ή Ισπανία.
- Add Value: Renovating older properties in urban centers like Lisbon ή Barcelona can boost value as demand increases during recovery.
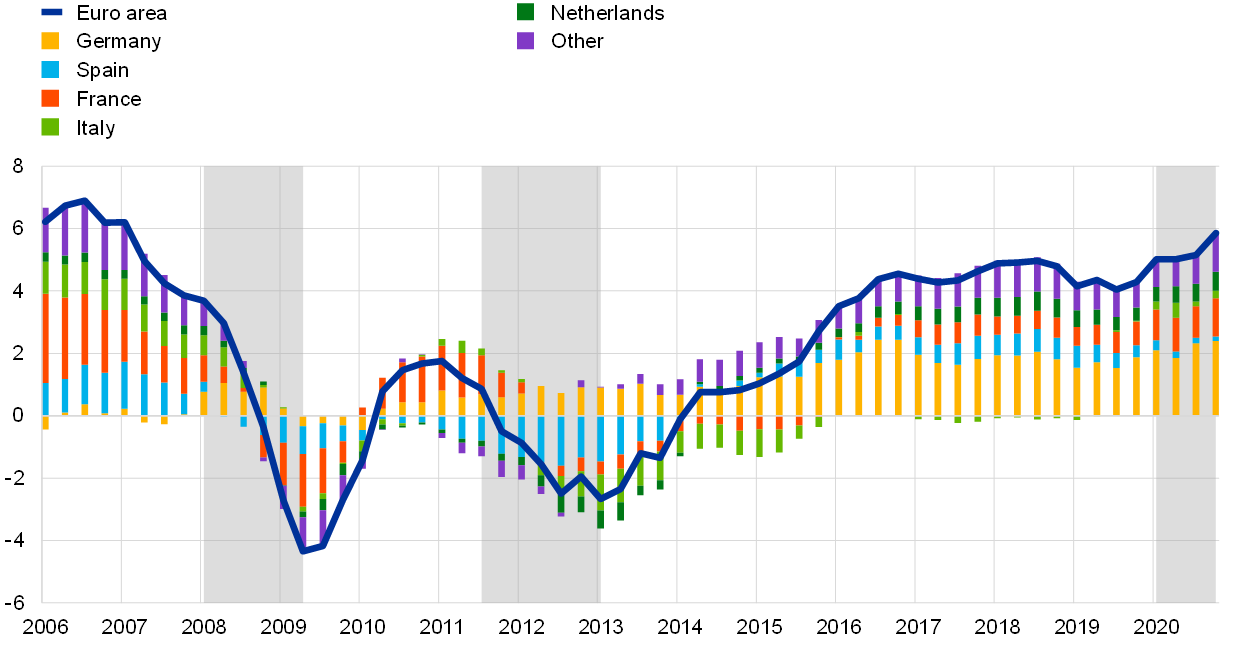
Εικόνα: Breakdown of Contributions to Euro Area GDP Growth
Περιγραφή:
This figure shows the components contributing to GDP growth in the Euro Area over time, with a focus on individual sectors such as consumption, investment, exports, imports, and government expenditure. The bars represent the contributions of each sector, while the blue line indicates the overall GDP growth. Shaded areas represent periods of economic recessions. By analyzing the chart, viewers can observe the fluctuations in GDP growth and identify how specific components influenced these trends during different time periods.
Βασικά συμπεράσματα:
- GDP growth is influenced by multiple components, including consumption, investment, and government spending.
- ο blue line demonstrates the overall GDP growth, with positive values indicating growth and negative values reflecting contraction.
- Periods of economic recessions are marked with shaded areas, highlighting downturns in economic activity.
- Contributions from exports and imports show the impact of international trade on the Euro Area’s economic performance.
- This figure provides insights into the relative importance of each sector in driving economic growth.
Εφαρμογή πληροφοριών:
Understanding this data allows investors and policymakers to assess economic health και το drivers behind GDP growth or contraction. It helps to evaluate how government policies or global economic trends influence specific sectors, aiding in decision-making related to investments, economic forecasting, and policy adjustments. This type of analysis is crucial for interpreting macroeconomic indicators and making informed financial decisions.
21.3 Expansion Phase in Europe
During the expansion phase, the European housing market experiences strong growth, driven by rising demand, high employment rates, and consumer confidence. Cities like Berlin και Paris often see significant property price appreciation during this phase.
Key Characteristics of the Expansion Phase:
- Property Prices: Rising steadily as demand increases.
- Vacancy Rates: Low, signaling strong demand for housing, particularly in urban centers.
- Construction: Increased activity, with new developments being built to meet growing demand.
- Investor Sentiment: Optimism and a focus on capturing growth in high-demand areas.
Historical Examples:
- Spain (1998-2007): Spain’s housing market boomed during this period due to rapid economic growth, foreign investment, and low-interest rates.
- Germany (2010-2020): The German housing market experienced steady growth throughout the 2010s, driven by strong economic fundamentals and a growing population.
Tips for European Investors During the Expansion Phase:
- Capitalize on Appreciation: In high-growth cities like Berlin, investors should look for early opportunities to benefit from rising property prices.
- Leverage Financing: Low-interest rates across Europe provide favorable conditions for leveraging investment properties.
- Focus on High-Demand Markets: Areas with significant population and job growth, such as Amsterdam και Stockholm, are ideal for investment during this phase.

Εικόνα: Spanish Property Prices and Percentage Changes (1996–2008)
Περιγραφή:
This figure shows the trend of Spanish property prices from 1996 to 2008, represented by the red line, along with the percentage changes over the same period indicated by the blue bars. The y-axis on the left corresponds to the property price levels, while the y-axis on the right represents the percentage changes. The chart highlights a steady increase in property prices starting in the late 1990s, peaking around 2007, followed by a sharp decline as the 2008 financial crisis began impacting the market. The blue bars indicate significant fluctuations in the annual growth rates of property prices.
Βασικά συμπεράσματα:
- Property prices in Spain grew consistently from 1996 to 2007, with a notable peak in 2007.
- Percentage changes in prices reveal volatility, particularly in the years leading up to the 2008 financial crisis.
- A sharp decline in both property prices and their growth rates is evident as the market reacts to the global economic downturn.
- The chart underscores the housing bubble phenomenon in Spain during the early 2000s.
Εφαρμογή πληροφοριών:
This data is essential for understanding the real estate market cycles and their vulnerabilities to economic shocks. For investors, it highlights the importance of monitoring economic indicators and market trends to avoid overexposure during periods of rapid growth and potential downturns. For policymakers, it underscores the need for regulatory measures to mitigate market overheating and manage risk during economic expansions.
21.4 Hyper-Supply Phase in Europe
The hyper-supply phase occurs when there is an oversupply of properties, leading to slower property price growth and rising vacancy rates. This phase can be seen in cities like Dublin και Madrid, where aggressive construction led to oversupply before the 2008 financial crisis.
Key Characteristics of the Hyper-Supply Phase:
- Property Prices: Growth slows as the market becomes saturated.
- Vacancy Rates: Increasing as new developments outpace demand.
- Construction: High levels of new construction activity contribute to oversupply.
- Investor Sentiment: Cautious, with concerns about potential downturns.
Historical Examples:
- Ireland (2006-2008): Ireland’s real estate market entered a hyper-supply phase before the financial crisis, with an excess of new developments and falling property prices.
- Spain (2007-2008): Following a construction boom, Spain’s housing market saw a significant rise in vacancy rates as supply outstripped demand.
Tips for European Investors During the Hyper-Supply Phase:
- Monitor Vacancy Rates: Investors should closely track vacancy rates, especially in cities like Dublin και Madrid, to assess market conditions.
- Avoid Over-Leveraging: Investors should maintain healthy cash reserves and avoid excessive debt during this phase.
- Consider Selling: If property prices have reached their peak, investors may consider selling properties before the market cools further.
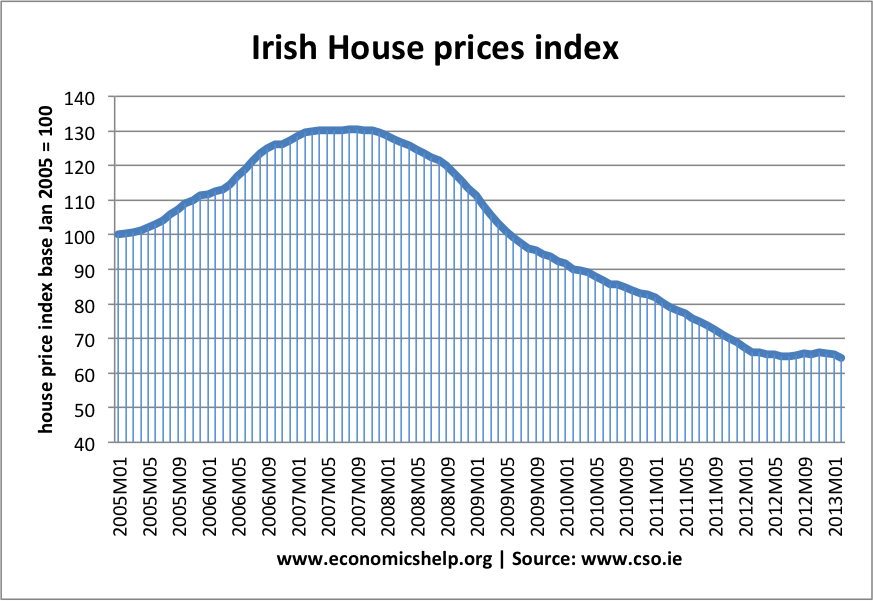
Figure: Irish House Price Index (2005–2013)
Περιγραφή:
This figure shows the Irish House Price Index from January 2005 to 2013, with January 2005 serving as the base index value of 100. The graph illustrates a steady rise in house prices from 2005, reaching a peak around mid-2007, followed by a sharp decline beginning in 2008 as the global financial crisis unfolded. By 2013, house prices had fallen significantly, with the index value dropping below 70, marking a dramatic downturn in the Irish property market.
Βασικά συμπεράσματα:
- House prices in Ireland increased significantly from 2005 to 2007, driven by strong demand and economic growth.
- The index peaked in 2007, reflecting the height of the property market boom before the financial crisis.
- From 2008 to 2013, house prices experienced a sharp decline, with the index dropping by more than 40%.
- The data highlights the severity of the housing market crash in Ireland, one of the most affected countries during the financial crisis.
Εφαρμογή πληροφοριών:
This data emphasizes the importance of monitoring macroeconomic trends and their impact on housing markets. For investors, it highlights the risks of overvaluation in property markets and the potential consequences of economic shocks. Learning from this data can help individuals make informed decisions about timing property investments and assessing risks in volatile markets. It also underlines the need for diversified investment strategies to manage exposure during economic downturns.
21.5 Recession Phase in Europe
The recession phase is marked by falling property prices, high vacancy rates, and weak demand for real estate. Economic downturns, such as the 2008 financial crisis, have triggered recessions in various European housing markets.
Key Characteristics of the Recession Phase:
- Property Prices: Declining, as demand for housing decreases.
- Vacancy Rates: High, due to reduced rental demand.
- Construction: Minimal, as new projects are halted or abandoned.
- Investor Sentiment: Pessimistic, with many investors holding back from the market.
Historical Examples:
- Greece (2009-2013): Greece’s housing market experienced a sharp downturn due to the country’s debt crisis, with plummeting property prices and halted developments.
- Spain (2008-2012): Spain’s housing market recession followed the global financial crisis, with significant declines in property values and a sharp rise in foreclosures.
Tips for European Investors During the Recession Phase:
- Seek Bargain Opportunities: Recessions present opportunities to purchase distressed properties in markets like Ελλάδα ή Ιταλία at discounted prices.
- Focus on Cash Flow: Investors should prioritize rental properties with stable tenants and consistent cash flow, rather than relying on property appreciation.
- Wait for Signs of Recovery: In markets like Ισπανία ή Πορτογαλία, investors should monitor economic indicators, such as declining vacancy rates, to identify the early stages of market recovery.
Βασικές πληροφορίες μαθήματος:
- The housing market cycle in Europe includes Ανάκτηση, Επέκταση, Hyper-Supply, και Υφεση. Each phase has its own characteristics, such as changing property prices, vacancy rates, και construction trends. Recognizing these can help investors time their decisions better.
- During the Recovery Phase, prices are still low and investor confidence is slowly rebuilding. Countries like Πορτογαλία, Ιταλία, και Ελλάδα present opportunities to buy undervalued properties, especially for investors who have a long-term vision or are willing to add value through renovations.
- In the Expansion Phase, strong economic growth drives property appreciation, low vacancy rates, and increased construction. Investors can capitalize on price growth, leverage low-interest financing, and focus on high-demand cities like Berlin and Amsterdam.
- The Hyper-Supply Phase is marked by too much construction and slowing demand. This leads to higher vacancy rates και slower price growth. Investors should be cautious, monitor the market closely, and avoid over-leveraging, especially in cities like Dublin and Madrid.
- The Recession Phase results in falling prices, high vacancies, and weak investor sentiment. While risky, this phase also presents bargain opportunities for long-term investors looking for discounted properties with stable cash flow in places like Greece or Spain.
Τελική δήλωση:
Κατανοώντας το European housing market cycle helps you make smarter investment decisions by recognizing when to enter or exit the market. Each phase comes with opportunities and risks, and knowing how to respond can protect your capital and help you grow wealth over time.
