
Local: : Financial Ratios in the European Banking Industry
Στόχοι Μαθήματος:
- Κατανοήστε το Capital Adequacy Ratio (CAR) and its significance in assessing the solvency of European banks under the Basel III standards and ECB regulations. This ratio is pivotal for ensuring that banks have sufficient capital to withstand financial downturns.
- Μάθετε για το Liquidity Coverage Ratio (LCR) and its role in ensuring that banks can meet short-term obligations, crucial for maintaining liquidity and stability in the banking sector.
- Gain insights into how Return on Equity (ROE) serves as a measure of profitability in the highly regulated European banking sector, helping stakeholders gauge the efficiency of banks in utilizing shareholder equity.
- Εξερευνώ Debt-to-Equity και Return on Capital Employed (ROCE) ratios in the European energy sector, understanding their importance in managing capital efficiently, especially in a market transitioning towards renewable energy.
- Discover how Free Cash Flow (FCF) provides a snapshot of a company’s financial flexibility and ability to fund projects, pay dividends, or reduce debt, which is especially relevant for energy companies investing in sustainable energy initiatives.

24.1 Financial Ratios in the European Banking Industry
Financial ratios are essential tools for analyzing a company’s financial health, and in the European Union (EU), industries like banking και energy are subject to specific regulations and economic conditions that affect how these ratios are applied. In this section, we explore key financial ratios within these industries, considering their unique regulatory and market environments.
ο banking sector in Europe operates under strict regulatory frameworks, such as the Basel III standards and oversight from the European Central Bank (ECB). Several financial ratios are vital in assessing the solvency, liquidity, and profitability of banks operating within the EU.
24.1.1 Capital Adequacy Ratio (CAR)
ο Capital Adequacy Ratio (CAR) is a critical solvency ratio for European banks. It measures a bank’s capital against its risk-weighted assets to ensure it can absorb potential losses.
- Formula: CAR = (Tier 1 Capital + Tier 2 Capital) / Risk-Weighted Assets
- Εφαρμογή: European banks are required by the ECB to maintain a minimum CAR of 10.5%, ensuring they have enough capital to handle financial downturns. Large banks like Deutsche Bank και Santander use CAR to demonstrate their capital strength and resilience.
24.1.2 Liquidity Coverage Ratio (LCR)
ο Liquidity Coverage Ratio (LCR) ensures that banks maintain a sufficient level of liquid assets to meet short-term obligations. It is an important measure for European banks, especially those exposed to different regulatory and economic environments across EU countries.
- Formula: LCR = High-Quality Liquid Assets / Total Net Cash Flows Over 30 Days
- Εφαρμογή: A higher LCR indicates the bank’s ability to cover its short-term obligations. The ECB mandates an LCR above 100%, particularly for banks with cross-border operations such as BNP Paribas και HSBC Europe.
24.1.3 Return on Equity (ROE) for European Banks
Return on Equity (ROE) evaluates a bank’s ability to generate profits from shareholders’ equity. In Europe, where regulatory constraints are stringent, ROE is a critical measure of profitability and operational efficiency.
- Formula: ROE = Net Income / Shareholders’ Equity
- Εφαρμογή: Due to regulatory pressure, ROE may be lower for European banks than global peers, but it remains a key measure of performance. Banks like ING Group και Lloyds Bank closely monitor ROE to ensure they are delivering value to shareholders.
24.2 Financial Ratios in the European Energy Industry
ο energy sector in Europe is heavily influenced by the EU Green Deal and other sustainability initiatives. Financial ratios used in this industry focus on capital efficiency, debt management, and profitability, especially in light of the sector’s transition toward renewable energy.
24.2.1 Debt-to-Equity Ratio in the Energy Sector
ο Debt-to-Equity Ratio measures how much debt a company is using to finance its assets relative to shareholders’ equity. This is particularly important for energy companies in Europe, which often rely on significant capital investment to develop large-scale projects.
- Formula: Debt-to-Equity Ratio = Total Debt / Shareholders’ Equity
- Εφαρμογή: Companies like TotalEnergies και Enel frequently use this ratio to manage their capital structure. A lower debt-to-equity ratio indicates financial health and reduced reliance on debt, which is critical given the volatility of the energy markets.
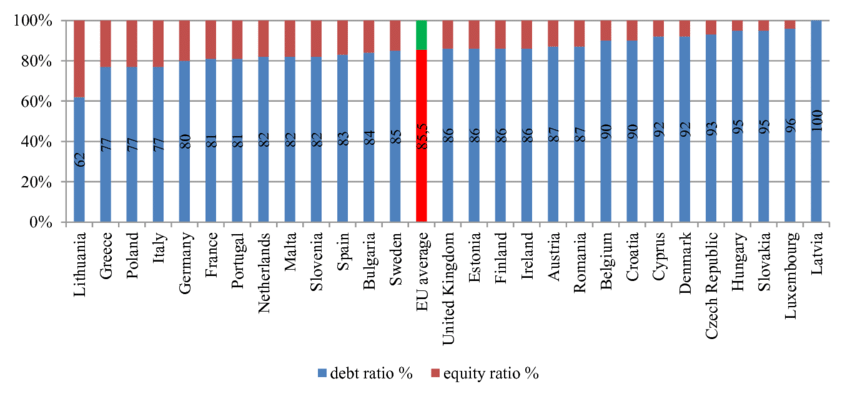
Εικόνα: Debt Ratio vs. Equity Ratio Across EU Countries
Περιγραφή:
This bar chart displays the debt ratio και equity ratio percentages for various EU countries. The blue bars represent the debt ratio, while the red bars represent the equity ratio in each country’s capital structure. The countries are arranged horizontally, with values presented as percentages on the vertical axis, ranging from 0% to 100%. The EU average is highlighted in red at 55%, indicating the average debt ratio across the region. This visualization provides a comparative look at how EU countries finance their operations through debt versus equity.
Βασικά συμπεράσματα:
- Debt ratio is higher than the equity ratio in most EU countries, indicating that companies rely more on debt than equity for financing.
- Λιθουανία has the lowest debt ratio (60%), while Λατβία has the highest (100%).
- ο EU average debt ratio stands at 55%, indicating that the typical EU company has a balanced mix of debt and equity.
- Countries like Germany, Italy, and Greece have notably higher debt ratios compared to their equity ratios.
- A lower debt ratio, such as seen in Λιθουανία και Ελλάδα, suggests greater reliance on equity financing, reducing financial risk.
Εφαρμογή πληροφοριών:
Investors can use this data to assess the financial health of companies in different EU countries. Countries with a lower debt ratio may represent lower financial risk and greater financial stability, which can be attractive to risk-averse investors. Conversely, countries with a higher debt ratio might indicate greater financial leverage but also potentially higher returns. Understanding these ratios helps investors make τεκμηριωμένες αποφάσεις about the risk and return profile of investments within the EU.
24.2.2 Return on Capital Employed (ROCE)
Return on Capital Employed (ROCE) is a profitability ratio that measures how well a company is using its capital to generate profits. In the energy sector, where large upfront investments are common, ROCE is essential for evaluating the efficiency of capital deployment.
- Formula: ROCE = EBIT / Capital Employed
- Εφαρμογή: Companies like Iberdrola και Shell rely on ROCE to assess the effectiveness of their investments in renewable energy infrastructure. A higher ROCE indicates that the company is using its capital efficiently, which is especially important in capital-intensive industries like energy.
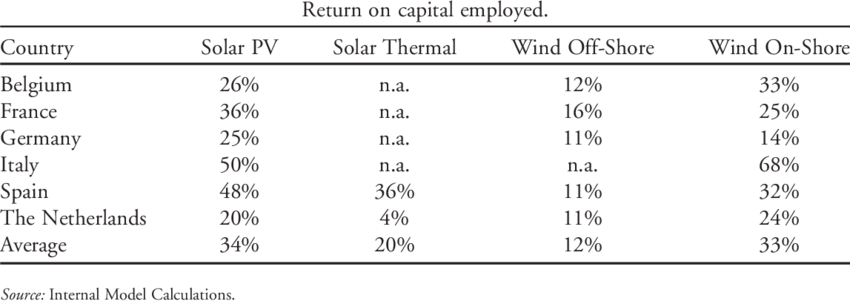
Εικόνα: Return on Capital Employed (ROCE) in Select EU Countries by Energy Source
Περιγραφή:
This table displays the Return on Capital Employed (ROCE) percentages for different renewable energy sources across select EU countries. The energy sources covered include Solar PV, Solar Thermal, Wind Off-Shore, και Wind On-Shore. Each column presents the ROCE for a given energy type, while each row represents a specific country. The table also provides an average ROCE for each energy source across all countries listed. Not available data is marked as “n.a.” for certain energy types in some countries.
Βασικά συμπεράσματα:
- Solar PV has the highest average ROCE among the renewable sources at 34%, with Spain leading at 48%.
- Wind On-Shore shows a significant variation, with Italy achieving the highest ROCE of 68%, while Germany has the lowest at 14%.
- Solar Thermal has limited data but shows an average ROCE of 20%.
- Wind Off-Shore has a consistent ROCE average of 12% across the countries that have available data.
- Ιταλία και Ισπανία generally exhibit higher returns on renewable energy investments compared to other countries.
Εφαρμογή πληροφοριών:
This data is useful for επενδυτές seeking to identify the most profitable renewable energy sectors across different EU countries. Higher ROCE values indicate better efficiency in generating returns from capital investments, making such sectors more attractive for investment opportunities. Investors can use this information to diversify their portfolios by focusing on countries and energy sources with the highest ROCE. This insight aids in decision-making related to capital allocation in the renewable energy sector.
24.2.3 Free Cash Flow (FCF) in the Energy Sector
Free Cash Flow (FCF) measures the cash a company generates after accounting for capital expenditures. It is a crucial ratio for energy companies as they need sufficient liquidity to fund new projects, pay dividends, and reduce debt.
- Formula: FCF = Operating Cash Flow – Capital Expenditures
- Εφαρμογή: For energy companies such as BP και Orsted, strong FCF indicates financial flexibility, especially as they invest heavily in renewable energy initiatives. High FCF allows these companies to reinvest in growth while maintaining a stable financial footing.
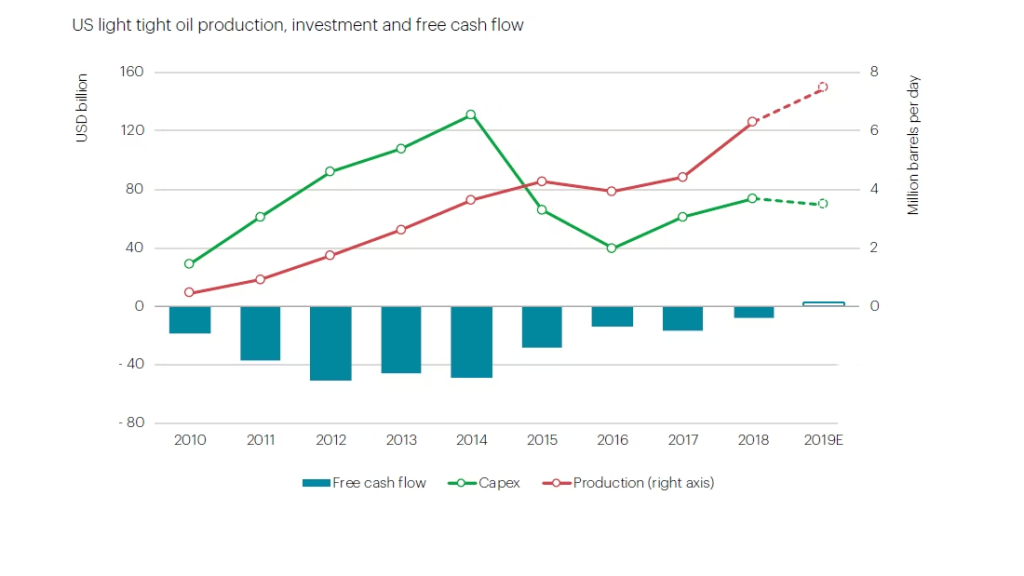
Εικόνα: US Light Tight Oil Production, Investment, and Free Cash Flow (2010-2019)
Περιγραφή:
This line and bar graph displays US light tight oil production, capital expenditure (Capex), και free cash flow from 2010 to 2019. The green line indicates Capex, while the red line shows oil production (measured on the right axis in million barrels per day). The blue bars at the bottom represent free cash flow, measured in USD billion. Capex peaked around 2014, coinciding with a production surge but followed by a decline due to market adjustments. Production levels continued to grow, particularly from 2016 onwards, while free cash flow remained mostly negative except for slight improvements in recent years.
Βασικά συμπεράσματα:
- Capex reached its highest point in 2014, reflecting increased investment in oil production, followed by a decline due to market corrections.
- Oil production showed a consistent upward trend, especially after 2016, reaching around 8 million barrels per day by 2019.
- Free cash flow was largely negative, indicating more investment outflows than inflows, except for slight improvements in recent years.
Εφαρμογή πληροφοριών:
This graph helps επενδυτές και analysts understand the relationship between investment levels, production growth, και cash flow in the US oil sector. It emphasizes the importance of balancing capital expenditure and maintaining positive cash flow for sustainable growth. Investors can use this data to evaluate the financial health of oil companies and identify potential periods of investment opportunities ή κινδύνους in the US oil industry.
συμπέρασμα
In the European Union, industry-specific financial ratios are crucial for analyzing the financial health and performance of companies, particularly in regulated sectors like banking και energy. In the banking sector, ratios such as the Capital Adequacy Ratio (CAR) και Liquidity Coverage Ratio (LCR) are critical for ensuring regulatory compliance and financial stability. Meanwhile, in the energy sector, ratios like Debt-to-Equity, ROCE, και Free Cash Flow provide insights into how companies manage large-scale investments and navigate the transition to renewable energy. These ratios help investors understand the financial dynamics of EU-based companies and how they respond to industry-specific challenges.
Βασικές πληροφορίες μαθήματος:
- ο Capital Adequacy Ratio (CAR) is essential for European banks, indicating their ability to cover potential losses with available capital, which is a critical aspect of financial health and regulatory compliance.
- ο Liquidity Coverage Ratio (LCR) ensures that banks maintain adequate levels of high-quality liquid assets to cover net cash outflows over a 30-day stress period, reflecting their short-term financial resilience.
- Return on Equity (ROE) is a key profitability metric for banks, influenced by stringent regulations in Europe, which indicates how effectively financial institutions are using invested capital to generate earnings.
- In the energy sector, the Debt-to-Equity Ratio helps assess the financial leverage of companies, while the Return on Capital Employed (ROCE) measures how effectively capital is being used to generate returns, particularly in capital-intensive renewable energy projects.
- Free Cash Flow (FCF) is crucial for energy companies, indicating their ability to generate cash that can be used for investment in growth opportunities, dividend payments, or debt reduction, highlighting financial health and operational efficiency.
Τελική δήλωση:
Mastering these financial ratios equips stakeholders with the analytical tools necessary to assess and make informed decisions in the European banking and energy sectors, ensuring compliance with regulatory standards and optimizing financial performance in line with market and economic conditions.
