Τοπικό: Εισαγωγή στους επιχειρηματικούς κύκλους και τις κατηγορίες περιουσιακών στοιχείων
Στόχοι Μαθήματος:
Understand the business cycle: Recognize the phases of expansion, peak, contraction, and recession, and how they influence investment decisions.
Identify different asset classes: Μάθετε για stocks, bonds, real estate, και εμπορεύματα, and their performance across business cycle stages.
Apply diversification strategies: Grasp the importance of διαφοροποίηση των επενδύσεων across different asset classes to mitigate risks and enhance portfolio resilience.
Interpret sector performance: Analyze how different sectors like technology, real estate, και financials perform during various phases of the business cycle.
Utilize economic indicators: Utilize figures and data to understand sector behavior and οικονομικοί δείκτες over decades, aiding in strategic investment planning.
6.5.1 Introduction to Business Cycles and Asset Classes
ο κύκλος επιχείρησης in Europe, like elsewhere, goes through phases of expansion, peak, contraction, και ύφεση. Different asset classes—αποθέματα, δεσμούς, ακίνητα, και εμπορεύματα—perform differently across these stages, driven by factors such as Πολιτικές της ΕΚΤ, επιτόκια, και economic growth. Understanding these phases is crucial for European investors who want to optimize their portfolios based on where the economy is in the cycle.
Figure: The infographic provides a clear breakdown of the five primary types of asset classes. It categorizes them into Equity, Bonds, Commodities, Real Estate, and Cash. Each category is further elaborated with examples. For instance, under Equity, it lists stocks, index funds, ETFs, and mutual funds. This visual guide is essential for beginners in finance and investment to understand the diverse avenues available for investment. Advice: When considering investments, it's crucial to diversify across different asset classes to mitigate risks. Each asset class has its own set of advantages and potential risks, so understanding them can help in making informed investment decisions. Source: Custom Infographic
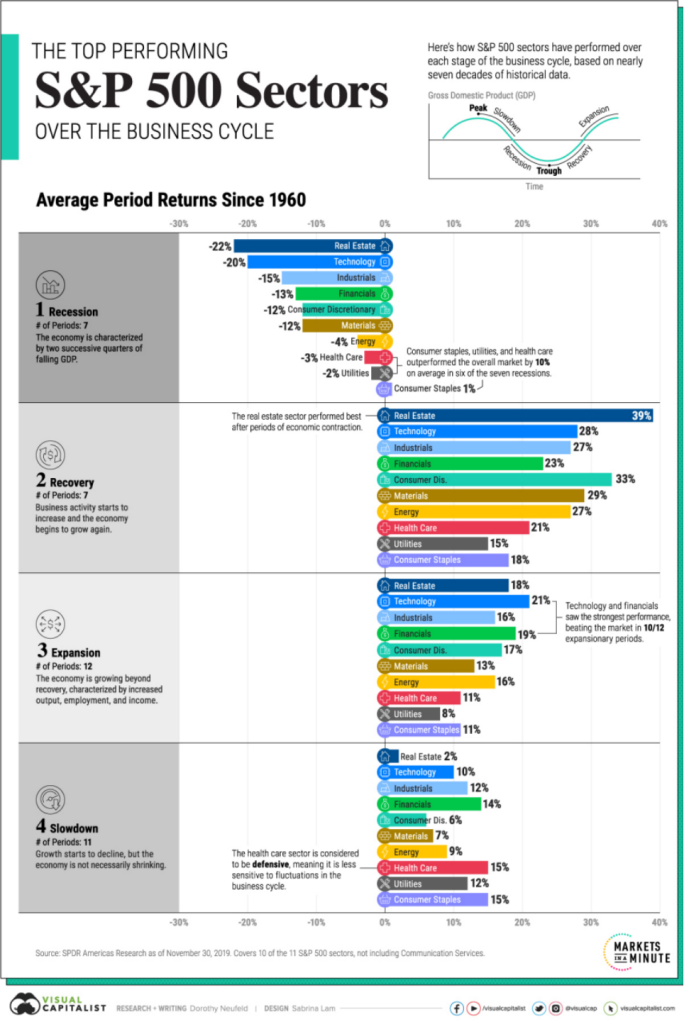
Εικόνα: Απόδοση των τομέων S&P 500 κατά τη διάρκεια του επιχειρηματικού κύκλου
Περιγραφή:
The figure shows the average period returns of S&P 500 sectors over different phases of the business cycle since 1960, including Υφεση, Ανάκτηση, Επέκταση, και Slowdown. Each phase highlights how sectors perform during distinct economic conditions. For example, Ακίνητα performs best during recovery, ενώ Τεχνολογία και Οικονομικά excel during expansion. The figure provides insights into sector behavior across seven decades, helping users understand which sectors may outperform in specific economic phases.
Βασικά συμπεράσματα:
Ακίνητα generally outperforms during recovery, with an average return of 39%.
Τεχνολογία και Οικονομικά lead during expansion, with returns of 28% and 23%, respectively.
During slowdowns, Φροντίδα υγείας is considered a defensive sector, offering more stable returns.
Των βασικών καταναλωτικών αγαθών, Βοηθητικά προγράμματα, και Φροντίδα υγείας outperform during υφέσεις, being less sensitive to economic downturns.
Εφαρμογή πληροφοριών:
Investors can use this data to optimize portfolio allocations based on expected economic phases. By identifying which sectors perform best during specific economic cycles, investors can strategically adjust their sector exposure to enhance returns and manage risks. Understanding sector performance across cycles can also help with διαποικίληση and improve decision-making during market volatility.
6.5.2 Stocks, Bonds, and Cash: A Primer
Αποθέματα: European stocks tend to perform well during periods of expansion when corporate earnings are rising. Sectors such as αυτοκινητοβιομηχανία, φαρμακευτικά προϊόντα, και financial services benefit most from GDP growth and increased consumer spending.
Δεσμούς: European bonds, particularly sovereign bonds σαν German Bunds, are viewed as safe investments, especially during the contraction phase when interest rates are low. Corporate bonds from large European companies also perform well in early expansion phases.
Μετρητά: Cash and equivalents, such as short-term government bonds ή money market funds, are typically favored in recessionary periods as they provide liquidity and protection against volatility.
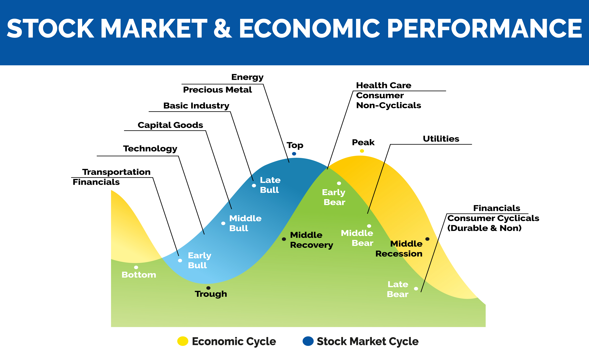
Figure: Stock Market & Economic Performance
Περιγραφή:
The figure illustrates the relationship between the economic cycle και το stock market cycle. It depicts the different stages of each cycle, including phases like Early Bull, Middle Bull, Late Bull, Early Bear, και Middle Recession. Key sectors such as Ενέργεια, Βοηθητικά προγράμματα, και Φροντίδα υγείας are aligned with specific phases, indicating their performance during economic transitions.
Βασικά συμπεράσματα:
ο economic cycle και stock market cycle have distinct but interconnected phases.
Sectors like Μεταφορά και Οικονομικά perform well in the early bull phase, while Βοηθητικά προγράμματα excel at the peak.
Basic industries και capital goods perform better in the middle bull phase, aligning with economic recovery.
Precious metals και ενέργεια typically peak during the late bull phase.
Φροντίδα υγείας και Consumer Non-Cyclicals offer stability during υφέσεις.
Εφαρμογή πληροφοριών:
Understanding the correlation between the economic cycle και stock market performance can help investors make informed decisions about sector allocation based on economic phases. By aligning investments with phases like recovery ή ύφεση, users can optimize returns and manage risk effectively. This approach aids in strategic portfolio diversification across economic conditions.
6.5.3 Early Expansion Phase
During the early expansion phase in Europe, economic recovery begins with rising GDP, low interest rates, and growing investor confidence.
Αποθέματα: European stocks, particularly in sectors like consumer discretionary και technology, tend to perform well as the economy rebounds.
Δεσμούς: High-yield corporate bonds are attractive as companies recover and their credit risk decreases.
Μετρητά: Cash is less attractive during this phase as investors seek higher returns in riskier asset classes.
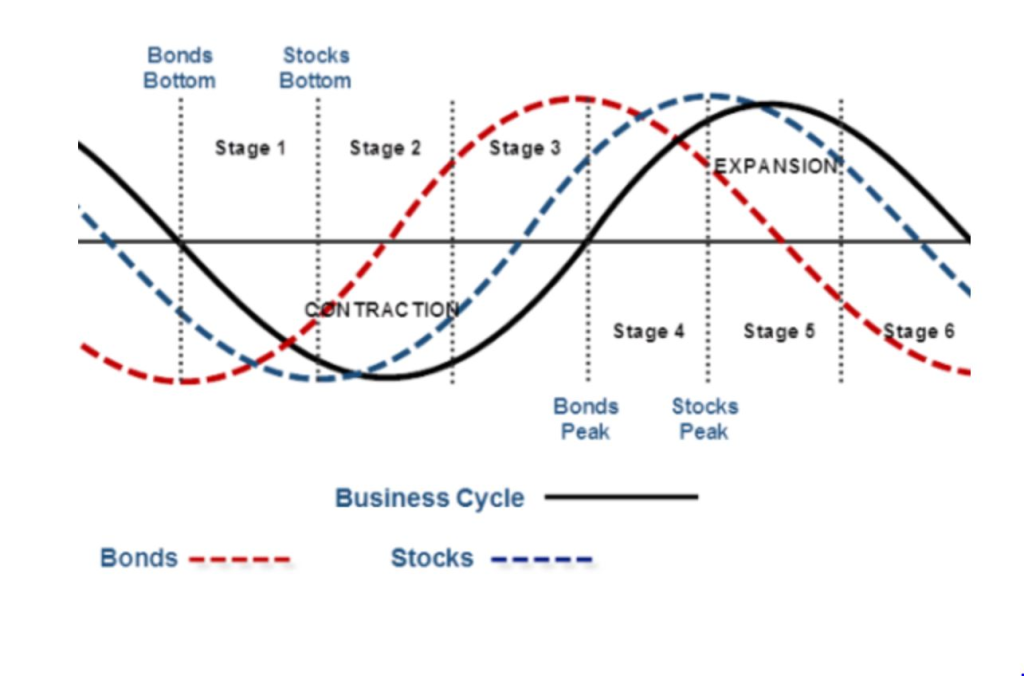
Εικόνα: Business Cycle and Market Phases
Περιγραφή:
The figure shows the relationship between the business cycle and the performance of bonds and stocks over six distinct stages. It demonstrates that δεσμούς tend to perform well during early stages of economic contraction, reaching their lowest point earlier than stocks. As the business cycle progresses towards economic expansion, stocks begin to recover and outperform bonds, peaking at later stages of the expansion.
Βασικά συμπεράσματα:
Δεσμούς generally perform well during the early contraction phase of the business cycle, peaking sooner than stocks.
Αποθέματα tend to bottom out after bonds and excel during the later expansion phase.
The cycle demonstrates distinct stages where different asset classes show stronger performance.
Understanding the timing of bonds’ and stocks’ peaks and bottoms can be crucial for effective διαχείριση χαρτοφυλακίου.
Εφαρμογή πληροφοριών:
Investors can use this information to align their επενδυτικές στρατηγικές with the business cycle, focusing more on δεσμούς during contraction and shifting towards αποθέματα as the economy expands. This helps optimize returns by timing asset allocation according to the specific phases of the business cycle.
6.5.4 Mid Expansion Phase
ο mid expansion phase in Europe brings stable growth and moderate inflation.
Αποθέματα: Sectors such as financial services και industrial goods perform strongly.
Δεσμούς: Corporate bonds remain attractive, but rising interest rates make κρατικά ομόλογα less appealing.
Μετρητά: Cash is still not a favored option, though it may be used by investors seeking to hedge against future volatility.
Εικόνα:
Περιγραφή:
Βασικά συμπεράσματα:
Εφαρμογή πληροφοριών:
6.5.5 Late Expansion Phase
In the late expansion phase in Europe, the economy begins to overheat, with rising inflation and tightening labor markets.
Αποθέματα: Defensive sectors like επιχειρήσεις κοινής ωφέλειας και healthcare start to outperform.
Δεσμούς: Government bonds become attractive again as investors seek safety amid rising interest rates.
Μετρητά: Cash becomes a more attractive asset class as the economy nears a potential downturn.
Εικόνα:
Περιγραφή:
Βασικά συμπεράσματα:
Εφαρμογή πληροφοριών:
6.5.6 Recession
During a ύφεση in Europe, economic activity contracts, and unemployment rises.
Αποθέματα: European stocks typically suffer significant losses, with cyclical sectors such as αυτοκινητοβιομηχανία και consumer discretionary being the hardest hit.
Δεσμούς: Government bonds, especially from stable economies like Germany, outperform as investors seek safety.
Μετρητά: Cash becomes the safest investment as market volatility increases.
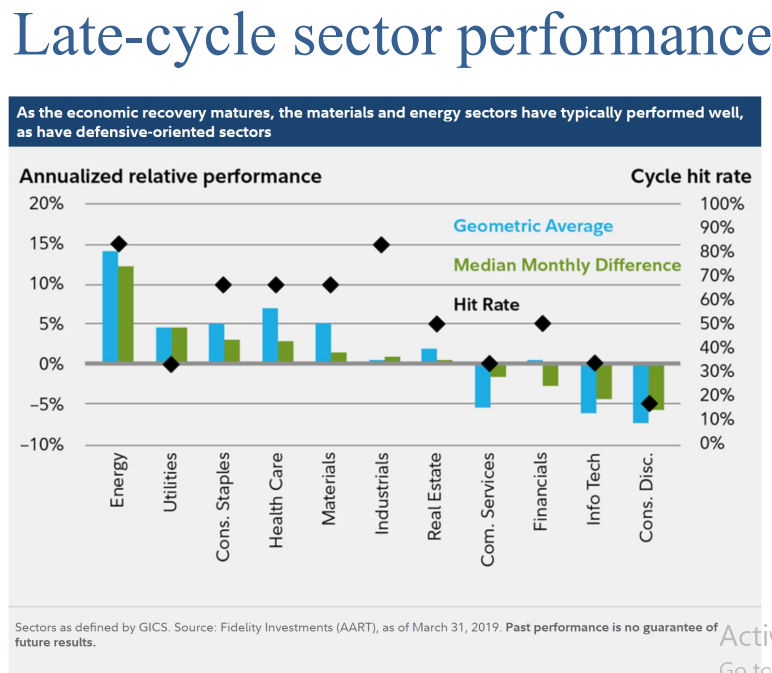
Εικόνα: Asset Allocation by Major BanksAsset Allocation by Major Banks
Περιγραφή:
This figure presents the asset allocation preferences of four major banks—J.P. Morgan (JPM), Goldman Sachs (GS), Morgan Stanley (MS), και Rothschild & Co.—across three categories: EU Government Bonds, EU Credit, και EU Equities. The positions are classified as material underweight (-), benchmark weight (neutral), ή material overweight (+), indicating each bank’s level of exposure or preference for these assets.
Βασικά συμπεράσματα:
J.P. Morgan is materially overweight on EU Equities while being neutral on EU Government Bonds και EU Credit.
Goldman Sachs shows a more balanced approach, favoring EU Credit και EU Equities as overweight positions while remaining neutral on EU Government Bonds.
Morgan Stanley maintains a neutral position on EU Government Bonds και EU Credit, with a slight overweight in EU Equities.
Rothschild & Co. adopts a material underweight stance in EU Government Bonds but a neutral stance on both EU Credit και EU Equities.
Εφαρμογή πληροφοριών:
Investors can use this information to understand the asset allocation preferences of major banks, which can guide their own επενδυτικές στρατηγικές. By observing how financial institutions position themselves in different asset classes, investors can make informed decisions about διαφοροποίηση χαρτοφυλακίου and potential market opportunities.
6.5.7 Real Estate and Commodities: An Overview
Ακίνητα: Real estate in Europe is influenced by local economic conditions, particularly interest rates and consumer demand. During expansion phases, commercial και residential real estate tends to perform well, while in recessions, property values may decline.
Εμπορεύματα: Commodities like oil και natural gas are key to Europe’s energy sector. Rising commodity prices benefit energy-exporting countries during the late expansion phase, while gold performs well during recessions as a safe-haven asset.
Εικόνα: Gold vs. a Single-Family Home
Περιγραφή:
The figure compares the year-over-year percentage difference in value between gold και single-family homes from 2011 to 2019. It shows annual changes for each asset, with gold depicted in yellow and housing in blue. For five out of these nine years, single-family homes exhibited a higher percentage increase in value than gold. Notable differences include 2011, where gold increased significantly by 23.5%, and 2013, where it dropped by -18.1%.
Βασικά συμπεράσματα:
Gold had a significant spike in 2011, while housing showed more stable growth over the period.
Μονοκατοικίες outperformed gold in terms of annual percentage increase for five of the nine years.
In 2013, gold experienced its largest decline, contrasting with a modest increase in housing.
ο housing market showed consistent growth from 2012 to 2019, suggesting more stable returns compared to gold.
Εφαρμογή πληροφοριών:
Investors can use this comparison to understand the relative stability of the housing market compared to gold, which can be more volatile. This data helps in deciding asset allocation, suggesting that ακίνητα may offer more consistent returns over time, while gold can act as a hedge during economic downturns.
6.5.8 Real Estate Across Business Cycle Stages
Πρώιμη επέκταση: Real estate begins to recover, with increased demand for housing and commercial properties.
Μεσαία επέκταση: Real estate thrives, with strong growth in both residential and commercial sectors.
Ύστερη επέκταση: Rising interest rates slow real estate growth, particularly in over-leveraged markets.
Υφεση: Real estate values typically decline due to reduced demand and tighter credit conditions.
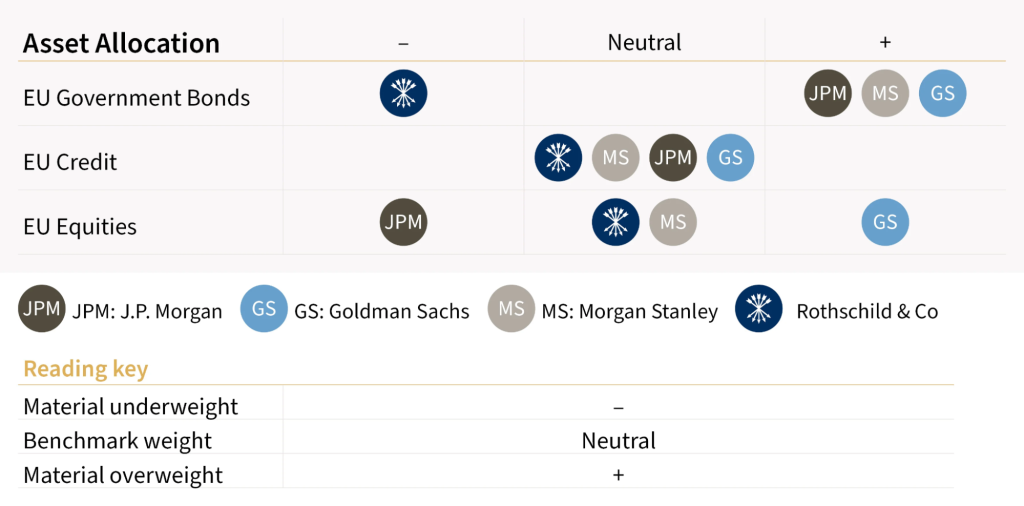
Εικόνα: Europe and Middle East Prime Rent Cycle
Περιγραφή:
The figure illustrates the prime rent cycle across various markets in Europe and the Middle East, highlighting different phases of performance over time. The cycle is divided into four stages: late upswing, early downswing, late downswing, και early upswing. It showcases how prime rents in cities like London, Frankfurt, Paris, Amsterdam, and Warsaw evolve through these stages, with certain markets peaking during the upswing and others declining during the downswing.
Βασικά συμπεράσματα:
London offices και Frankfurt logistics are at the peak of the late upswing phase.
Παρίσι, Άμστερνταμ, και Dubai residential enter the early downswing phase, indicating declining prime rents.
Madrid retail και Lisbon offices reach the late downswing phase, representing lower performance.
Markets like Warsaw retail και Milan residential start to enter the early upswing, signaling potential recovery in prime rents.
Εφαρμογή πληροφοριών:
Κατανοώντας το prime rent cycle is crucial for real estate investors, as it helps identify the best entry and exit points in different markets. This knowledge can guide investment strategies, highlighting when to focus on growth markets during the early upswing or consider divestment during the downswing phases.
6.5.9 Commodities Across Business Cycle Stages
Πρώιμη επέκταση: Commodities like industrial metals recover as production ramps up.
Μεσαία επέκταση: Commodities, particularly ενέργεια και agriculture, perform well as consumption increases.
Ύστερη επέκταση: Gold becomes attractive as an inflation hedge.
Υφεση: Commodities like oil decline due to reduced demand, but gold performs well as a safe-haven asset.
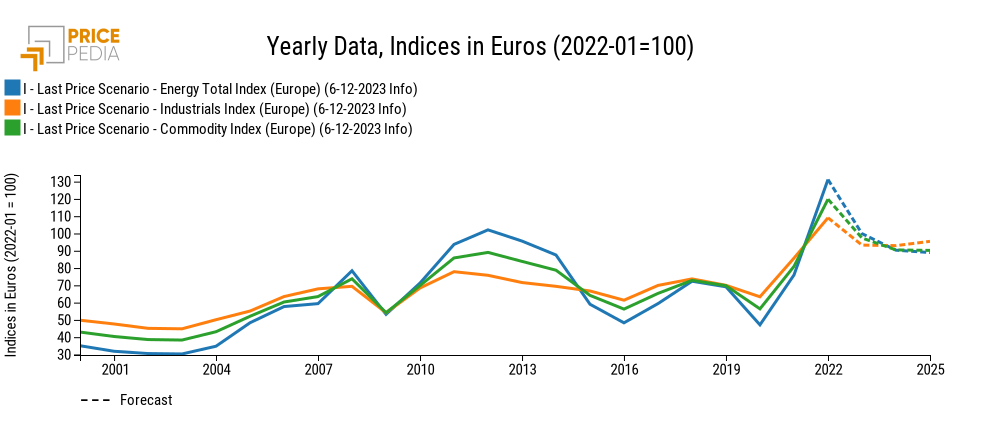
Εικόνα: Yearly Data, Indices in Euros (2022-01=100)
Περιγραφή:
The figure displays the yearly trends of three indices in Europe from 2000 to 2025, including the Energy Total Index, Industrials Index, και Commodity Index. Each index starts from a base value of 100 in January 2022, reflecting how the indices have fluctuated over time. The forecast section, represented by dashed lines, shows the projected movement of these indices up to 2025.
Βασικά συμπεράσματα:
ο Energy Total Index has shown the highest volatility over time compared to the other indices.
There was a noticeable dip across all indices around 2009, coinciding with the global financial crisis.
The forecast indicates a gradual decline in all three indices, reflecting an anticipated economic slowdown in 2024 and 2025.
ο Industrials Index remains relatively stable compared to energy and commodity indices over the observed period.
Εφαρμογή πληροφοριών:
This data helps investors understand the historical and projected price trends in energy, industrials, and commodities sectors in Europe. Investors can use this information to adjust their επενδυτικές στρατηγικές, anticipate potential risks, and make informed decisions regarding sector-specific allocations, especially considering projected declines.
Βασικές πληροφορίες μαθήματος:
Business cycles dictate asset performance: Asset classes such as real estate, technology, και financials have distinct performances tied to economic phases like recovery και expansion.
Diversification is key: By diversifying across asset classes, investors can reduce risks and take advantage of growth opportunities in different economic conditions.
Sector-specific insights are valuable: Understanding which sectors outperform during specific business cycle phases can lead to more informed investment strategies.
Economic indicators are essential tools: Utilizing economic indicators and sector performance data helps in anticipating market conditions and aligning investments accordingly.
Strategic planning enhances returns: Aligning investment strategies with the κύκλος επιχείρησης phases facilitates better διαχείριση κινδύνου and potential for higher returns.
Τελική δήλωση
Mastering the dynamics of the business cycle and its impact on different asset classes equips investors with the knowledge to make informed, strategic decisions that optimize returns and manage risks effectively.