
Global: Análisis técnico
Objetivos de aprendizaje de la lección:
- Understand the principles of top-down investing. You’ll learn how to analyze broad economic factors, such as El crecimiento del PIB, interest rates, y sector performance, to identify favorable conditions before selecting companies within those sectors. This approach helps you capitalize on macroeconomic trends.
- Explore bottom-up investing. This strategy focuses on evaluating the fundamentals of individual companies, such as earnings reports, balance sheets, y competitive advantages. You will learn how to identify strong companies with growth potential, regardless of broader economic trends.
- Compare buy & hold investing with active trading. You will learn the differences between these two approaches: buy & hold focuses on long-term growth, while active trading aims for short-term profits by timing market movements. You’ll understand which strategy suits different types of investors.
- Learn about the dollar-cost averaging strategy. This method involves investing a fixed amount of money at regular intervals, reducing the impact of market volatility. You’ll see how this approach can smooth out the effects of market fluctuations and help keep you on track with your investment goals.
Introducción
Technical analysis is a widely-used method by investors to evaluate securities and make informed trading decisions based on price movements, volume, and other market data. It differs from fundamental analysis, which focuses on a company’s intrinsic value and financial health. Instead, technical analysis looks for patterns and trends in stock prices to predict future market behavior. This chapter covers the essentials of technical analysis, including top-down and bottom-up investing, buy-and-hold vs. active trading strategies, and the dollar-cost averaging approach.
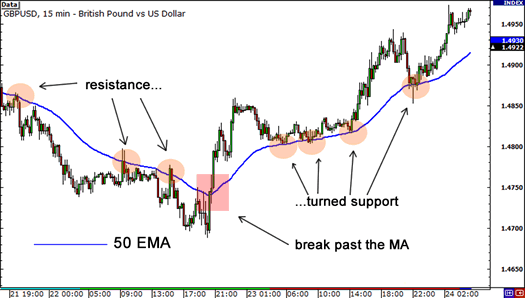
Cifra: GBP/USD Chart: 50 EMA, Resistance, and Support Dynamics
Descripción:
This chart displays a 15-minute candlestick pattern of the GBP/USD exchange rate, highlighting the use of the 50-period Exponential Moving Average (EMA) as a dynamic indicator for support and resistance. Initially, the EMA serves as a resistance level, as prices repeatedly fail to break above it. Subsequently, the price breaks past the EMA, turning it into a support level, where prices bounce off it several times. This transition from resistance to support is marked by price actions interacting with the EMA line.
Conclusiones clave:
- 50 EMA can act as a dynamic resistance during a downtrend and as apoyo during an uptrend.
- A break past the EMA indicates a potential change in market direction.
- Successful retests of the EMA as support suggest strengthening upward momentum.
- This pattern showcases the importance of moving averages in identifying trend reversals y continuations.
Application of Information:
Traders can use the 50 EMA as a tool to identify dynamic support and resistance levels during trading sessions. Observing whether the price breaks above or below the EMA and whether it holds as support or resistance can help traders decide when to enter or exit positions, especially in trending markets. This approach aids in recognizing potential trend reversals o confirming ongoing trends.
A. Top-Down and Bottom-Up Investing
There are two primary approaches to conducting investment research: top-down investing y bottom-up investing. Each approach provides a different perspective on how to evaluate market opportunities and determine where to invest.
A.1 Top-Down Investing
Top-down investing begins by analyzing broad macroeconomic factors such as global and regional economic conditions, industry trends, and sector performance before narrowing down to specific companies. Investors following this approach look for favorable economic environments that will foster growth in certain sectors. After selecting the best-performing sectors, they then identify companies within those sectors with strong growth potential.
For instance, if an investor believes that a low-interest-rate environment will benefit the technology sector, they may begin by analyzing global economic data, narrowing their focus to the technology sector, and finally selecting companies like Apple o Microsoft that are expected to perform well within this context.
This approach helps investors understand how broader economic trends impact industries and companies, providing a framework to capitalize on large-scale trends. However, it may overlook exceptional companies that thrive even when macroeconomic conditions are unfavorable.
A.2 Bottom-Up Investing
Bottom-up investing focuses on the performance and fundamentals of individual companies rather than broader economic or industry trends. Investors in this category prioritize a company’s financial health, competitive advantage, and growth potential. They believe that strong companies will succeed regardless of the overall economic climate.
For example, a bottom-up investor may examine a company’s earnings reports, balance sheets, y competitive positioning to determine if it is a good investment opportunity. This method often involves detailed analysis of valuation metrics like the price-to-earnings (P/E) ratio, return on equity (ROE), y free cash flow.
Bottom-up investors believe that companies with a strong competitive advantage—such as proprietary technology or strong brand loyalty—are more likely to succeed long-term, even in adverse economic conditions. This approach is often used by value investors seeking long-term opportunities in companies with strong fundamentals.
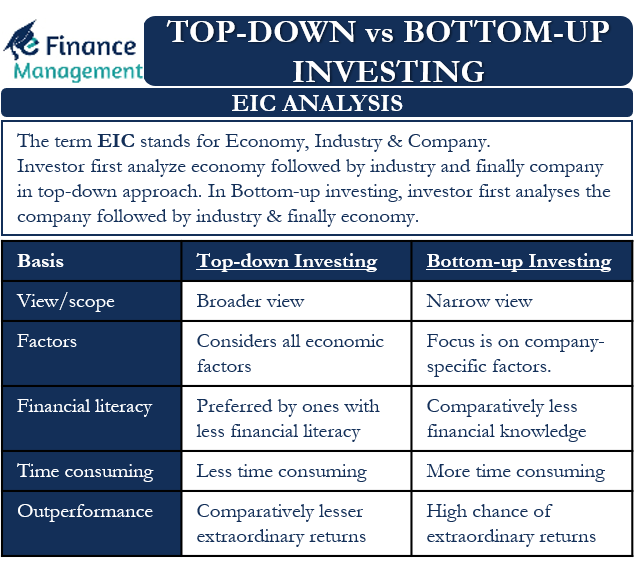
Cifra: Top-Down vs. Bottom-Up Investing: EIC Analysis
Descripción:
This table compares De arriba hacia abajo y Bottom-Up Investing, focusing on EIC Analysis, which stands for Economy, Industry, and Company. In the De arriba hacia abajo approach, investors first analyze the overall economía, followed by specific industries, and finally, individual companies. In contrast, the De abajo hacia arriba approach starts with an analysis of companies, then industries, and lastly, the economy. The comparison includes aspects such as view/scope, factors considered, required financial literacy, time consumption, and the likelihood of achieving extraordinary returns.
Conclusiones clave:
- Top-Down Investing provides a broader view and considers all economic factors, making it less time-consuming but generally offering less extraordinary returns.
- Bottom-Up Investing has a narrower focus on company-specific factors, requires more financial knowledge, is more time-consuming, but offers a higher chance of extraordinary returns.
- Top-Down Approach is suitable for investors with less financial literacy, while the Bottom-Up Approach is often preferred by those with more financial expertise.
Application of Information:
Understanding the differences between De arriba hacia abajo y Bottom-Up Investing helps investors determine the approach that aligns with their investment goals, financial literacy, y time availability. Those new to investing or looking for broader market exposure might opt for Top-Down Analysis, while more experienced investors seeking high returns from specific companies may prefer the Bottom-Up Approach.
B. Buy & Hold vs. Active Trading
When it comes to investing strategies, investors often choose between buy & hold y active trading approaches. Both strategies offer different benefits, and the choice depends largely on the investor’s time horizon, risk tolerance, and investment goals.
B.1 Buy & Hold Investing
Buy & hold investing is a long-term strategy where investors purchase stocks or ETFs and hold them for extended periods, regardless of short-term market fluctuations. The aim is to benefit from the natural growth of the market or company over time.
Investors using this strategy believe that markets, over the long run, generally increase in value despite short-term volatility. For instance, by holding on to shares of a company like Amazon o Google, buy & hold investors expect to see significant appreciation in the stock’s value over many years.
One of the key advantages of buy & hold investing is compounding returns—where dividends or capital gains are reinvested, creating exponential growth over time. This strategy requires minimal active management and is cost-effective since it involves fewer transactions, thus reducing fees and tax liabilities.
This approach works best for investors with long-term goals, such as retirement planning o wealth accumulation, and is particularly effective in reducing the emotional responses to market volatility.
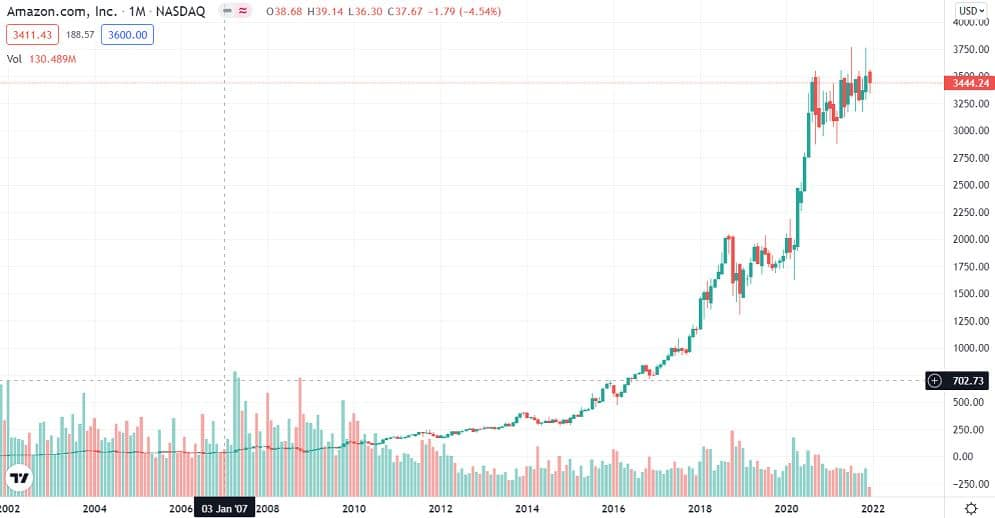
Cifra: Amazon.com, Inc. (AMZN) Stock Price Chart (2002 – 2022)
Descripción:
The chart depicts the monthly stock price of Amazon.com, Inc. (AMZN) from 2002 to 2022 on the NASDAQ. It shows a steady upward trend in Amazon’s stock price over the 20-year period, illustrating the company’s significant growth. The vertical bars below the price line represent trading volume, with green indicating increased volume and red indicating decreased volume in respective months. The graph clearly highlights periods of consolidation, followed by strong growth spurts, especially after 2016, reaching all-time highs by 2022.
Conclusiones clave:
- Consistent growth in Amazon’s stock price from 2002 to 2022 shows its strong market presence and successful business model.
- High trading volume often correlates with significant price movements, indicating increased investor interest.
- Amazon experienced sharp price increases particularly after 2016, coinciding with major business expansions.
- The chart emphasizes the benefits of a long-term buy-and-hold strategy in a company with sustained growth potential.
Application of Information:
This chart is useful for investors to understand the effectiveness of a long-term buy-and-hold strategy, especially in growth-oriented stocks like Amazon. Observing the price trends over a long period helps investors learn to ignore short-term volatility and focus on long-term gains, making it a valuable visual for both novice and experienced investors.
B.2 Active Trading
Comercio activo involves the frequent buying and selling of securities to take advantage of short-term price movements. Unlike buy & hold investors, active traders attempt to time the market by entering and exiting positions based on technical indicators and price patterns.
Active traders use tools like candlestick charts, moving averages, y relative strength indices (RSI) to identify opportunities for profit. They aim to capitalize on small fluctuations in stock prices, sometimes executing multiple trades in a single day.
While active trading can offer substantial returns in a short period, it carries higher risk due to its reliance on short-term market movements. Moreover, frequent trading incurs higher transaction fees and capital gains taxes, which can reduce overall profits if not managed carefully. This strategy is more suited for experienced investors who are comfortable with high-frequency trading and understand how to manage risk effectively.
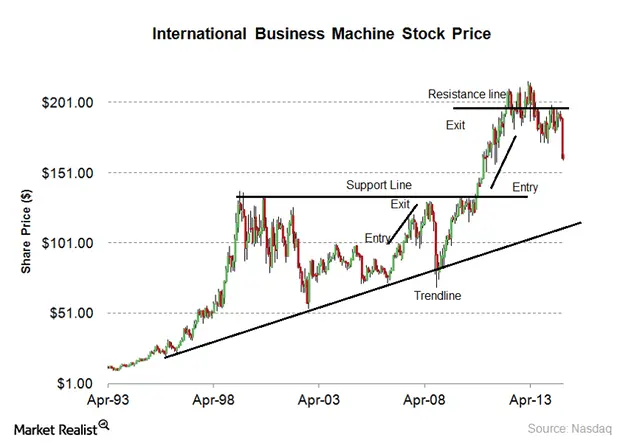
Cifra: Comprensión del análisis técnico en la inversión bursátil
Descripción:
The chart shows the stock price movement of International Business Machines (IBM) from April 1993 to April 2013. It illustrates key support and resistance levels that guide trading decisions. The trendline indicates an overall upward movement in the stock price over the two-decade period. The chart also marks potential entry y exit points, where traders could have entered or exited positions based on price movements relative to the support, resistance, and trendline.
Conclusiones clave:
- Support and resistance levels are crucial indicators of potential buying or selling opportunities in trading.
- Líneas de tendencia can help identify long-term upward or downward trends in a stock’s price.
- El entry and exit points shown in the chart help illustrate optimal times to enter or exit trades based on the stock’s interaction with these levels.
Application of Information:
Understanding support, resistance, and trendlines is essential for investors and traders in making informed trading decisions. This knowledge helps in identifying potential buy or sell opportunities and improves gestión de riesgos strategies. Analyzing charts like this aids investors in applying análisis técnico to anticipate future price movements and make better trading decisions.
C. Dollar-Cost Averaging Strategy
Promedio del costo en dólares (DCA) is an investment strategy where investors consistently invest a fixed amount of money into a stock, ETF, or other asset at regular intervals, regardless of the asset’s price. By spreading out investments over time, DCA helps investors reduce the impact of market volatility.
For example, an investor may decide to invest $500 every month into an S&P 500 ETF. When the market is down, they buy more shares at a lower price; when the market is up, they buy fewer shares at a higher price. Over time, the average cost of the shares tends to even out, which reduces the risk of investing a lump sum at an unfavorable time.
DCA is particularly effective in volatile or uncertain markets, where price fluctuations are more common. It also removes the emotional aspect of trying to time the market, as the regularity of the investment process ensures that investors stay committed to their long-term goals.
Conclusión
Top-down and bottom-up investing, buy & hold vs. active trading, and the dollar-cost averaging strategy are key approaches within technical analysis and portfolio management. Each strategy offers unique benefits depending on an investor’s time horizon, risk tolerance, and financial goals. By understanding and applying these approaches, investors can develop a well-rounded investment strategy that aligns with their objectives, whether they prioritize long-term growth or short-term trading opportunities.
Información clave de la lección:
- Top-down investing starts with macroeconomic analysis. Investors begin by analyzing broad economic conditions, such as interest rates and GDP growth, to identify favorable sectors. Once sectors are selected, investors choose companies within those sectors expected to perform well in the current environment. This method helps you focus on large-scale economic trends.
- Bottom-up investing focuses on company-specific fundamentals. Investors prioritize analyzing individual companies based on their financial health, competitive advantages, y growth potential. This strategy works well for identifying strong companies that can perform well regardless of broader economic conditions.
- Buy & hold investing is a long-term strategy. This approach involves purchasing stocks or ETFs and holding them over extended periods. The goal is to benefit from compounding returns as the market grows. It is a cost-effective strategy since it involves fewer transactions and offers significant growth over time, particularly in growth-oriented companies like Amazon.
- The choice between top-down and bottom-up investing depends on your goals. Top-down investing is ideal for those seeking exposure to broader market trends, while bottom-up investing is better for those who want to focus on individual companies with strong fundamentals. Both approaches have their advantages depending on the investor’s strategy.
Frase de cierre:
By understanding the differences between top-down and bottom-up investing, buy & hold versus active trading, and strategies like dollar-cost averaging, you can make informed decisions on the best investment strategy that aligns with your financial goals, time horizon, and risk tolerance. These strategies provide different approaches to achieving long-term financial success.
