बुनियादी वित्तीय अवधारणाएँ
मुख्य शिक्षण उद्देश्य:
परिचय: This section introduces you to the core financial statements and key financial data
points essential in analyzing a company’s financial health and making informed investment decisions.
1. Financial Statements Understanding: Grasp the significance of the income statement,
balance sheet, and cash flow statement in evaluating a company’s financial performance.
2. Income Statement Proficiency: Become proficient in analyzing a company’s revenues and
expenses over a specific period, understanding its profitability.
3. Balance Sheet Analysis: Learn to evaluate a company’s financial position by delving into its
assets, liabilities, and equity at a particular point in time.
4. Cash Flow Statement Insights: Gain insights into a company’s cash inflows and outflows,
understanding how the firm manages its cash across operations, investments, and financing.
5. Key Financial Data Points: Master the use of crucial metrics like dividend yield, beta, and
volume for evaluating a company’s performance and making informed investment decisions.
परिचय
In this chapter, we will introduce you to the three primary financial statements: the income statement, balance sheet, and cash flow statement. Understanding these statements is essential for making informed financial decisions and evaluating a company’s financial health. We will provide detailed explanations of each statement, examples with numerical data, and lists of common transactions. By the end of this chapter, you will have a solid foundation in financial statement analysis.
22.1. Financial Statements
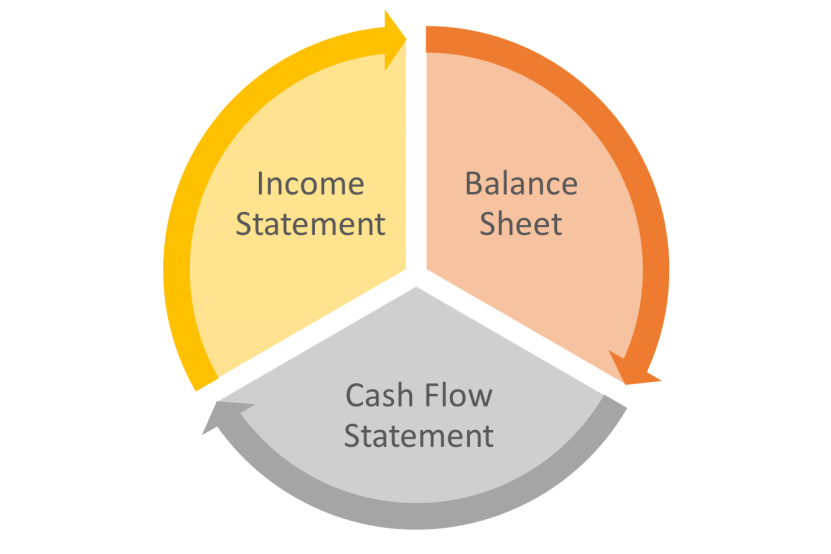
Figure title: Interconnected Financial Statements
स्रोत: Club Capital Blog
विवरण: The figure gives a comprehensive view of how the three primary financial statements—income statement, balance sheet, and cash flow statement—are interrelated, affecting one another through various financial data points.
चाबी छीनना:
- Income Statement: This shows a company’s revenues and expenses, essentially telling you how much money a company made or lost.
- Balance Sheet: This shows a company’s assets, liabilities, and equity, essentially giving you a snapshot of what a company owns and owes.
- Cash Flow Statement: This tells you where a company’s money came from and where it went, considering operations, investments, and financing.
आवेदन: By studying these interconnected financial statements, an investor can gain a holistic understanding of a company’s financial health and operational efficiency, aiding in long-term investment decisions.
A. Income Statement
The income statement, also known as the profit and loss statement, provides a summary of a company’s revenues and expenses over a specific period, typically a quarter or a year. It shows the company’s profitability during that time.
Key Components:
- Revenues: Money earned from selling goods or services
- खर्च: Costs incurred in running the business, such as salaries, rent, and depreciation
- शुद्ध आय: The difference between revenues and expenses, representing the company’s profit
Sample Income Statement:
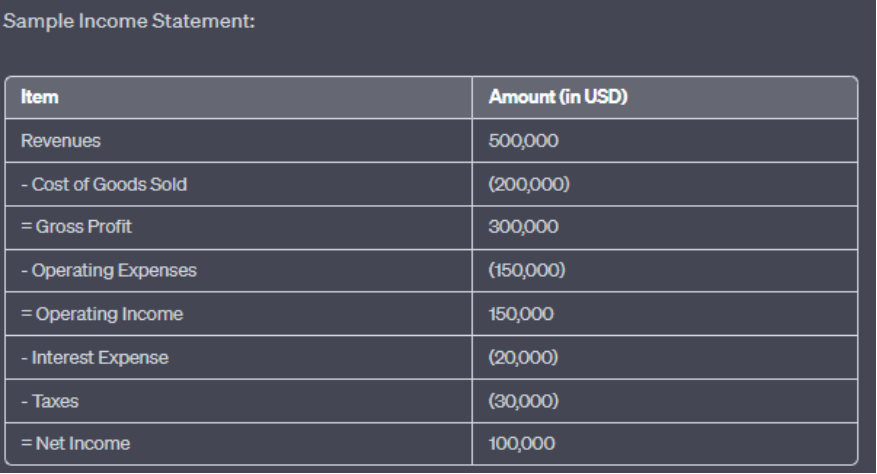
Figure title: Sample Income Statement
स्रोत: कस्टम इन्फोग्राफिक
विवरण: The image presents a sample income statement, breaking down the financial performance of a company over a specific period. It starts with the total revenues and subtracts various expenses to arrive at the net income.
The statement showcases the following items:
Revenues: $500,000
Cost of Goods Sold: $(200,000)
Gross Profit: $300,000
Operating Expenses: $(450,000)
Operating Income: $150,000
Interest Expense: $(20,000)
Taxes: $(30,000)
Net Income: $100,000
चाबी छीनना:
- Revenues: The total amount of money brought in by the company before any expenses.
- Cost of Goods Sold (COGS): The direct costs attributable to the production of the goods sold.
- Gross Profit: The profit a company makes after deducting COGS from its total revenues.
- Operating Expenses: The costs associated with the day-to-day operations of the business.
- Operating Income: The profit from business operations (before interest and taxes).
- Interest Expense: The cost of borrowing funds.
- करों: The amount paid to the government based on the company’s taxable income.
- शुद्ध आय: The total profit of the company after all expenses have been deducted from revenues.
आवेदन पत्र: An income statement is a fundamental financial document that provides investors and stakeholders with insights into a company’s profitability over a specific period. By analyzing the income statement, one can understand the company’s revenue streams, cost structure, and overall financial health. This data is crucial for making informed investment decisions and assessing the company’s operational efficiency.
Common Transactions:
Sales revenue: Money earned from selling products or services
Cost of goods sold (COGS): Direct costs associated with producing goods or delivering services
Operating expenses: Indirect costs, such as salaries, rent, and marketing
Depreciation: Allocation of the cost of tangible assets over their useful lives
Interest expense: Cost of borrowing money
Taxes: Amount paid to the government based on the company’s earnings
B. Balance Sheet Statement
The balance sheet provides a snapshot of a company’s financial position at a specific point in time. It shows the company’s assets, liabilities, and equity.
Key Components:
- Assets: Resources owned by the company that have economic value, such as cash, inventory, and property
- देयताएं: Debts and obligations owed by the company, such as loans and accounts payable
- Equity: Ownership interest in the company, representing the residual interest after liabilities are subtracted from assets
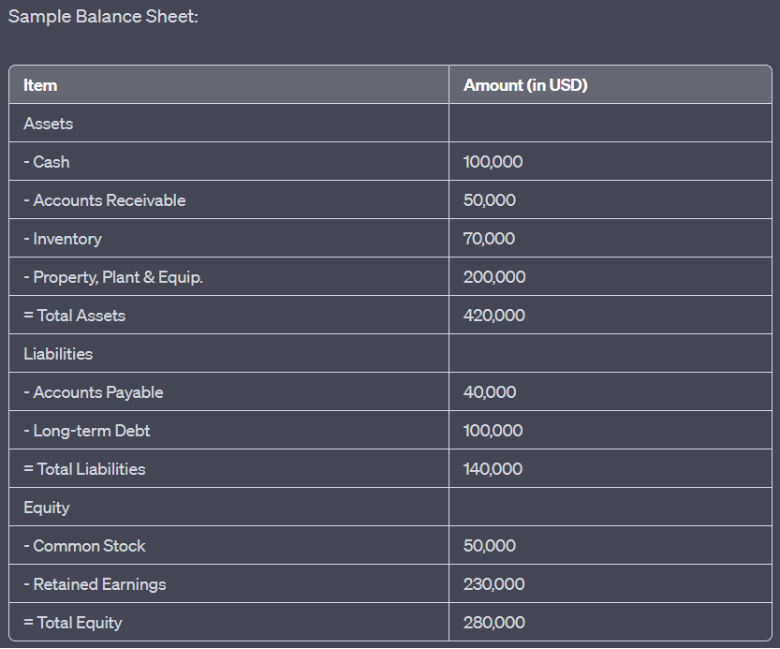
Figure title: Sample Balance Sheet
स्रोत: कस्टम इन्फोग्राफिक
विवरण: The image displays a sample balance sheet, which provides a snapshot of a company’s financial position at a specific point in time. It categorizes the company’s resources (assets) and the claims against those resources (liabilities and equity). The balance sheet showcases the following items:
- संपत्ति: Totaling $420,000, including Cash ($400,000), Accounts Receivable ($50,000), Inventory ($70,000), and Property, Plant & Equipment ($200,000).
- देयताएं: Totaling $140,000, comprising Accounts Payable ($40,000) and Long-term Debt ($400,000).
Equity: Totaling $280,000, with Common Stock ($50,000) and Retained Earnings ($230,000).
चाबी छीनना:
-
- संपत्ति: Resources owned by the company that have economic value.
- देयताएं: Obligations the company owes to external entities.
- Equity: Represents the ownership interest in the company, including funds invested by shareholders and accumulated profits.
- The fundamental accounting equation: Assets = Liabilities + Equity.
आवेदन: A balance sheet is a foundational financial statement that offers insights into a company’s financial health. By analyzing the balance sheet, stakeholders can assess the company’s liquidity, solvency, and overall financial stability. This information is vital for investors, creditors, and other stakeholders to make informed decisions related to the company’s financial position
Common Transactions:
- Accounts receivable: Money owed to the company by customers for goods or services provided
- Inventory: Goods held for sale or used in the production process
- Accounts payable: Money owed by the company to suppliers for goods or services received
- Long-term debt: Borrowings that the company must repay in more than one year
- Common stock: Shares issued by the company, representing an ownership interest
- Retained earnings: Cumulative net income that has not been distributed as dividends
C. Cash Flow Statement
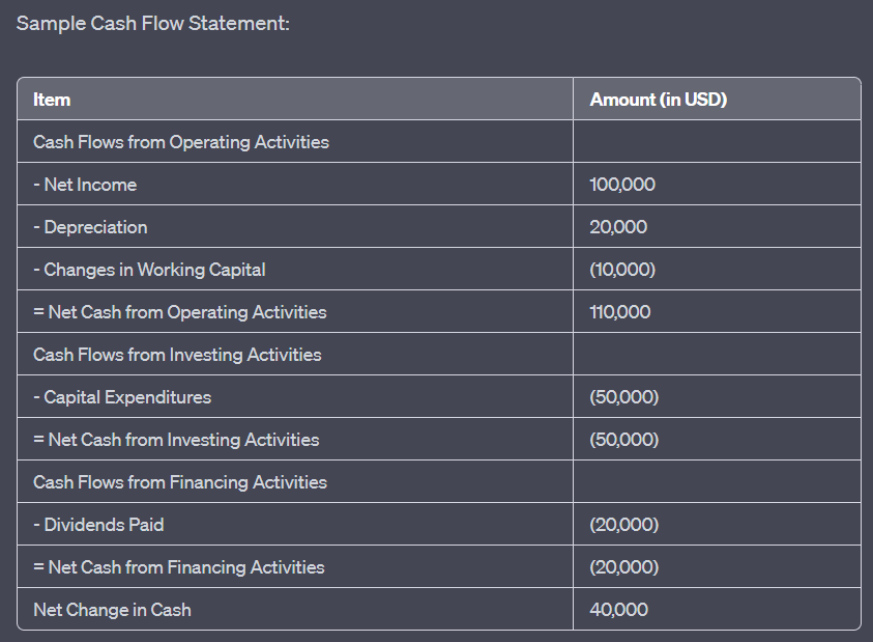
Figure title: Sample Cash Flow Statement
स्रोत: कस्टम इन्फोग्राफिक
विवरण: The image illustrates a sample cash flow statement, which provides a detailed account of the cash inflows and outflows for a company over a specific period. The statement is segmented into three main categories: Operating Activities, Investing Activities, and Financing Activities. The key items include:
Cash Flows from Operating Activities: Net Income ($100,000), Depreciation ($20,000), and Changes in Working Capital (-$10,000), resulting in a Net Cash from Operating Activities of $110,000.
Cash Flows from Investing Activities: Capital Expenditures (-$50,000), leading to a Net Cash from Investing Activities of -$50,000.
Cash Flows from Financing Activities: Dividends Paid (-$20,000), resulting in a Net Cash from Financing Activities of -$20,000.
The overall Net Change in Cash is $40,000.
चाबी छीनना:
- Operating Activities: Reflects the cash generated or used in the core business operations.
- Investing Activities: Represents cash used for investments in assets or received from the sale of assets.
- Financing Activities: Showcases the cash flows from or to external financing sources, like lenders and shareholders.
- The Net Change in Cash provides a snapshot of the overall increase or decrease in the company’s cash position over the period.
आवेदन: The cash flow statement is an essential financial tool that offers insights into a company’s liquidity and its ability to generate and use cash effectively. By analyzing the cash flow statement, stakeholders can understand how a company manages its cash resources, which is crucial for assessing its financial health and making informed investment decisions.
Common Transactions:
- मूल्यह्रास: Non-cash expense that reduces the value of tangible assets
- Changes in working capital: Changes in current assets and current liabilities, such as inventory and accounts payable
- Capital expenditures: Cash spent on acquiring or upgrading long-term assets, such as property or equipment
- Dividends paid: Cash distributed to shareholders as a return on their investment
निष्कर्ष
Understanding financial statements is essential for evaluating a company’s financial health and making informed investment decisions. By mastering the income statement, balance sheet, and cash flow statement, you will have a solid foundation in financial statement analysis. As you progress through the course, we will continue to explore these statements in greater detail, providing you with the tools and knowledge necessary to excel in your financial journey.
22.2 Key Financial Data Points
परिचय
In this chapter, we will explore various financial data points that are essential for evaluating a company’s performance and making informed investment decisions. By understanding these metrics, you can assess the financial health of a company, compare it to its peers, and determine its potential for growth and profitability. Let’s dive into some key financial data points that every investor should know.
- Dividend and Dividend Yield
लाभांश are cash payments made by companies to their shareholders, usually on a quarterly basis. The dividend yield is a financial ratio that indicates the annual dividend payment divided by the current market price of the stock. It shows the percentage of return an investor can expect from the stock through dividends.
उदाहरण:
Company A pays an annual dividend of $1.00 per share
The current market price of Company A’s stock is $20.00
Dividend Yield = ($1.00 / $20.00) x 100 = 5%
Beta: Beta measures the stock’s volatility relative to the overall market. A beta greater than 1 indicates that the stock is more volatile than the market, while a beta less than 1 means it is less volatile. A beta of 1 implies the stock moves in line with the market.
- आयतन
Volume represents the number of shares traded in a stock during a specific time frame, usually daily. High volume indicates that there is a significant interest in the stock, while low volume suggests limited interest. Analyzing volume can help investors identify trends and potential buying or selling opportunities.
Other Data Points
- Earnings per Share (EPS): The portion of a company’s profit allocated to each outstanding share of common stock
- Price-to-Earnings (P/E) Ratio: The ratio of a company’s stock price to its earnings per share, used to assess valuation
- Price-to-Sales (P/S) Ratio: The ratio of a company’s stock price to its revenue per share, used to compare valuation across companies in the same industry
- Price-to-Book (P/B) Ratio: The ratio of a company’s stock price to its book value per share, used to assess the company’s valuation relative to its net asset value
- Current Ratio: The ratio of a company’s current assets to its current liabilities, used to evaluate liquidity and short-term financial health
- Debt-to-Equity Ratio: The ratio of a company’s total debt to its shareholders’ equity, used to assess the company’s leverage and financial risk
Analyzing Companies Financial Statements

आकृति: Business professionals analyzing data graphs, showcasing economic growth and financial investment. The image emphasizes the use of hologram charts and graphs, highlighting modern business strategy concepts and data analysis technology.
स्रोत: iStockफोटो
Before you invest in any company, you need to understand financial statements.
Here we will use Apple Inc. as our example.
Currently, you can find the 2022 Consolidated Statements here: https://www.apple.com/newsroom/pdfs/FY23_Q1_Consolidated_Financial_Statements.pdf
The full detailed report for the year can be found here:
https://s2.q4cdn.com/470004039/files/doc_financials/2022/q4/_10-K-2022-(As-Filed).pdf
We will use these statement as examples:
There are 3 different types of financial statements:
- Income statement or otherwise known as statement of operation
- Balance Sheet
- Cash Flow statement
In this section we will focus on analyzing the income statement of a company
Overview of the Income Statement
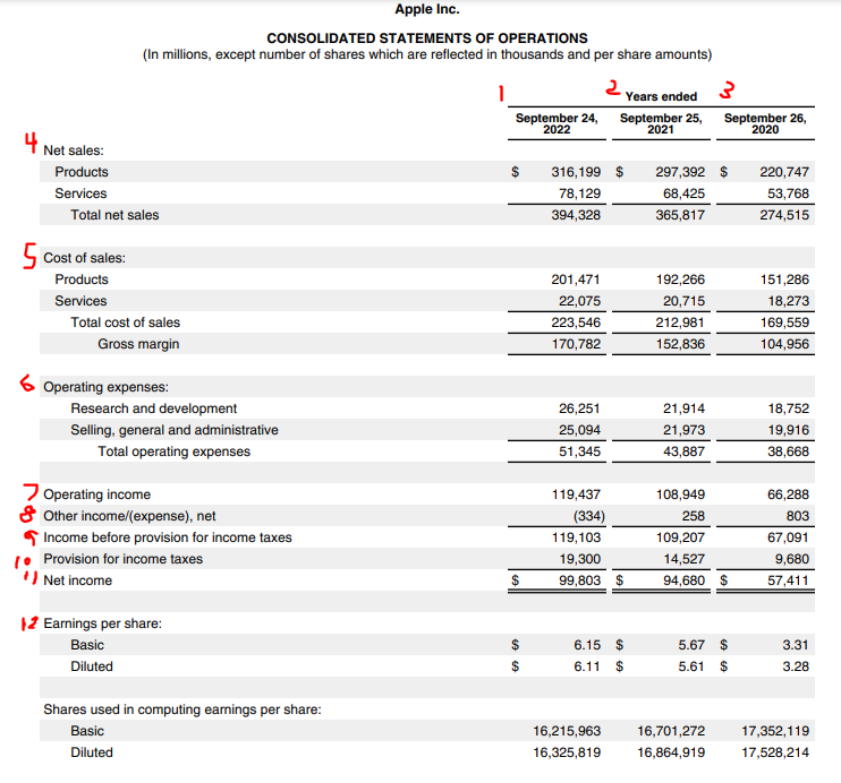
Figure title: Apple Inc. Consolidated Statements of Operations
स्रोत: Apple Inc
विवरण: The image provides a detailed breakdown of Apple Inc.’s consolidated statements of operations. It showcases various financial metrics, including net sales from products and services, cost of sales, gross margin, operating expenses, and net income. The statement is presented in millions, with specific figures for products, services, research and development, and administrative costs. It also provides earnings per share data, both basic and diluted, along with the number of shares used in computing these figures.
चाबी छीनना:
- Total Net Sales: Apple’s combined net sales from products and services amounted to $394.328 million.
- Gross Margin: The company achieved a gross margin of $170.782 million after deducting the total cost of sales.
- Operating Income: After accounting for operating expenses, Apple’s operating income stood at $119.437 million.
- Net Income: The statement does not explicitly mention the net income figure, but it can be derived by subtracting the provision for income taxes from the income before taxes.
- Earnings Per Share: The diluted earnings per share is $3.28, calculated using 17,528,214 shares.
आवेदन पत्र: The consolidated statement of operations provides a comprehensive view of Apple Inc.’s financial performance over a specific period. Investors and financial analysts can use this data to assess the company’s profitability, operational efficiency, and overall financial health. Understanding these metrics is crucial for making informed investment decisions and predicting future financial performance.
Here is the income statement for Apple for 2022.
We will go over a few key aspects of this statement. At the top denoted by the numbers 1, 2, 3 you can see the dates; this indicates the performance of the company during different periods. This allows you to conduct a time series analysis to see how the values have changed over time.
First, lets review what an income statement is. An income statement shows a company’s revenue, expenses and profitability over a period of time. It can be referred to as a profit and loss statement as it contains the revenue from your business and subtracts the expenses to calculate your net income or net profit.
(4) Represents the revenue for the business. Next, (5) shows the cost of sales, this would represent for Apple the cost to produce the merchandise they sell. Revenue – Cost of Sales = Gross margin, this helps indicate the company’s profit margins.
(6) is operating expenses and has different categories such as research and development, selling, general, and administration.
You then take can calculate operating income as follows:
Revenue – (Total Cost of Sales + Total Operating Expense) = Operating income (7)
(8) is other income and expense; these are items that are not normal to the business you are in. This would be, for example, Apple paying interest payments as an expense. An example of other income for Apple may be the sale of a building, as they are not in the real estate investment business, and this transaction would not be a part of their normal business activity.
(9) Is income before provision and income taxes, this is calculated by adding the other income/expense to operating income. This income before provision and income tax shows the income before you pay your taxes; using this you calculate your income tax payment (10) and subtract this to arrive at your net income (11). Net income for a company is a critical metric and one that investors care a lot about, it shows how overall profitable the business taking into account all revenue and expenses.
Lastly, you can then calculate earnings per share, which is calculated by dividing the net income by the number of outstanding shares. Earning per share is useful as it indicates how profitable the company is per share, which indicates its ability to grow, pay dividends, and also service future debt.
It is important to note from these data points on the income statement’s unique financial ratios. Using our application, you can see the financial statements of any stock and the financial ratios to help you better analyze the company.
चाबी छीनना:
Closing Statement: The mastery of बुनियादी वित्तीय अवधारणाएँ is a cornerstone for making well-informed
investment decisions. As you become adept at analyzing financial statements and understanding key
financial data points, you step into a realm of deeper market analysis and smarter investment strategies.
1. Financial Statements are essential tools for understanding a company’s financial health.
2. Every investor should familiarize themselves with the primary financial statements और यह
critical metrics, as these tools enable better investment decisions.
3. The Income Statement shows profitability, the Balance Sheet depicts a company’s financial
standing at a moment in time, and the Cash Flow Statement reveals how cash moves in and
out of the company.
4. Using financial data points, investors can assess a company’s value, growth potential, and
overall financial health.

