
नकदी प्रवाह और निवेश पर रिटर्न की गणना
मुख्य शिक्षण उद्देश्य:
परिचय: This section sheds light on the power of leveraging in real estate investments. By understanding the nuances of borrowed capital and its potential rewards and risks, investors can craft a strategy that amplifies their returns and minimizes potential pitfalls.
- Understand Leverage: Grasp the concept of using borrowed capital, typically in the form of mortgages, to finance real estate investments, and its implications.
- Recognize Benefits of Leverage: Dive deep into the benefits such as increased buying power, portfolio diversification, tax incentives, amplified returns, and enhanced cash flow.
- Acknowledge Risks: Understand that while leverage can be beneficial, it also comes with inherent risks such as cash flow challenges, interest rate fluctuations, market volatility, decreased flexibility, and potential default.
- Master Risk Management Strategies: Equip oneself with tools and strategies to mitigate potential risks associated with leveraging, including maintaining cash reserves, diversifying, conservative leveraging, and ensuring adequate insurance among others.
I. Key Metrics and Methods for Evaluating Real Estate Investments
Cash-on-Cash Return
Cash-on-Cash Return: This metric calculates the annual return on a real estate investment by dividing the annual cash flow by the initial investment, expressed as a percentage. For example, if an investor purchases a property for $100,000 and earns $10,000 in annual cash flow, the cash-on-cash return would be 10%.
- पेशेवर: Simple calculation, easy to understand
- दोष: Doesn’t account for potential appreciation, doesn’t consider the time value of money
- Best Practices: Useful for comparing investments with similar cash flow profiles
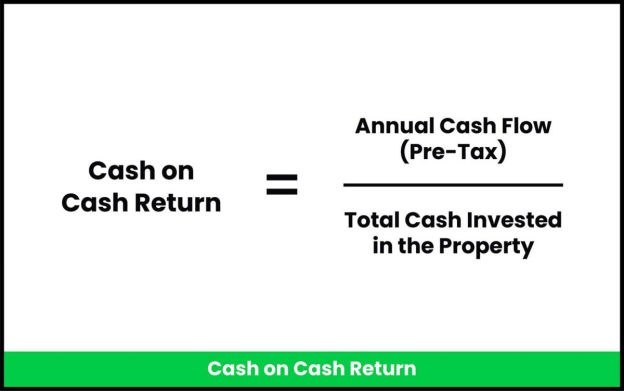
चित्र का शीर्षक: Cash on Cash Return Formula
स्रोत: Lev
विवरण: The image presents a formula to calculate the “Cash on Cash Return” for real estate investments. The formula is depicted as this formula helps investors determine the annual return on the cash they have invested in a property, excluding the effects of tax.
चाबी छीनना:
- Annual Cash Flow (Pre-Tax): This represents the yearly income generated from the property before considering taxes.
- Total Cash Invested in the Property: This is the total amount of money the investor has put into the property, including down payments, renovations, and other initial costs.
- Cash on Cash Return: This metric provides investors with a percentage that indicates the annual return on their cash investment.
आवेदन: The Cash on Cash Return is a crucial metric for real estate investors as it provides a clear picture of the profitability of their investment in relation to the cash they have invested. It allows investors to compare the performance of different properties and helps in making informed investment decisions. By understanding this metric, investors can better gauge the efficiency of their investment and its potential for generating positive cash flow.
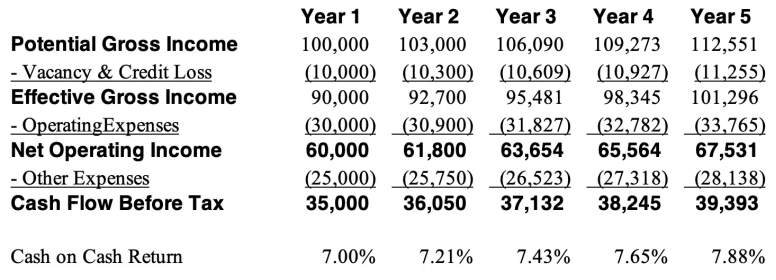
चित्र का शीर्षक: Calculation of Cash on Cash Return for a $500,000 Investment
स्रोत: Property Metrics
विवरण: The graph illustrates the step-by-step calculation of the Cash on Cash Return for a real estate investment of $500,000. The process is as follows:
- Potential Gross Income (PGI): This represents the total income the property could generate without considering any losses or expenses.
- Vacancy and Credit Loss Deduction: From the PGI, any losses due to vacant units or credit defaults are subtracted. This gives a more realistic income figure, accounting for potential non-occupancies or payment defaults.
- Effective Gross Income (EGI): After accounting for vacancy and credit losses, we arrive at the EGI, which is a more accurate representation of the property’s income potential.
- Operating Expenses Deduction: From the EGI, all operating expenses associated with maintaining and running the property are subtracted. This includes costs like maintenance, property management fees, utilities, and more.
- Net Operating Income (NOI): After deducting operating expenses from the EGI, we get the NOI. This represents the income generated from the property after all operational costs but before any financing or capital expenses.
- Other Expenses Deduction: From the NOI, other expenses such as mortgage payments, capital expenditures, or any other financial obligations are subtracted.
- Cash Flow Before Taxes (CFBT): After accounting for all expenses, we get the CFBT, which is the actual cash inflow an investor can expect before considering taxes.
- Cash on Cash Return Calculation: Finally, the CFBT is divided by the initial investment amount ($500,000) to calculate the Cash on Cash Return. This metric provides a percentage that indicates the annual return on the cash investment.
चाबी छीनना:
- The Cash on Cash Return provides a clear picture of the profitability of a real estate investment in relation to the cash invested.
- It accounts for potential income, operational costs, and other financial obligations to give a realistic return figure.
- The metric is crucial for investors to gauge the efficiency of their investment and its potential for generating positive cash flow.
आवेदन: Understanding the Cash on Cash Return is vital for real estate investors. It allows them to assess the performance of their investment, compare different investment opportunities, and make informed decisions. By following the steps outlined in the graph, investors can get a clear picture of the potential returns and risks associated with a property.
Capitalization Rate
Capitalization Rate (Cap Rate): This method measures the rate of return on a property based on its net operating income (NOI) and market value. The cap rate is calculated by dividing the NOI by the market value of the property, expressed as a percentage. For example, if a property generates $50,000 in NOI and has a market value of $500,000, the cap rate would be 10%.
- पेशेवरों: Widely used, accounts for both income and property value
- दोष: Doesn’t consider financing costs, assumes NOI remains constant
- सर्वोत्तम प्रथाएं: Useful for comparing similar properties and assessing market trends
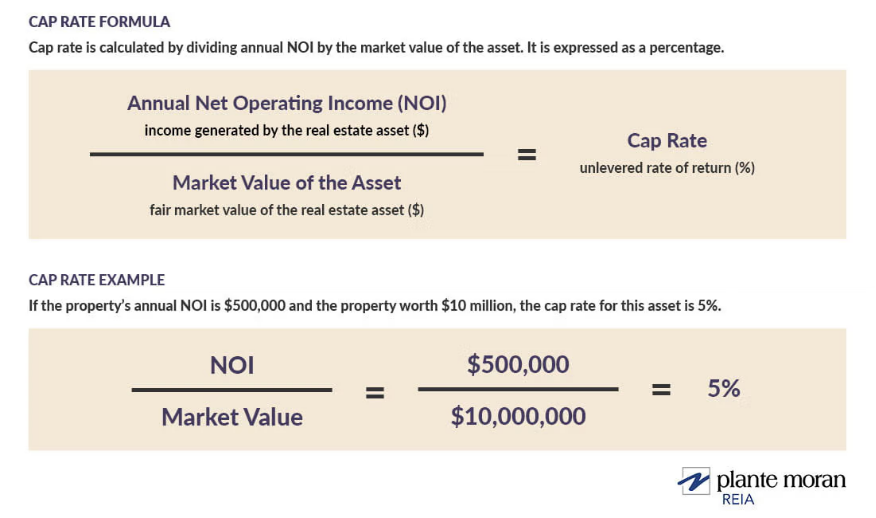
चित्रा शीर्षक: Understanding Cap Rate in Real Estate Investing
स्रोत: Plante Moran
विवरण: The image likely illustrates the formula and concept of the “Cap Rate” in real estate investing. The Cap Rate, or capitalization rate, is a metric used to determine the rate of return on a real estate investment property. It is calculated by dividing the annual Net Operating Income (NOI) by the market value of the property. For instance, if a property has a market value of $10 million and generates an NOI of $500,000, the Cap Rate would be 5%.
चाबी छीनना:
\(\textbf{Cap Rate Formula:}\)
\[ \displaystyle \text{Cap Rate} = \left(\frac{\text{Annual NOI}}{\text{Market Value of Property}}\right) \times 100 \]
\(\textbf{किंवदंती:}\)
\(\text{Cap Rate}\) = Capitalization rate
\(\text{Annual NOI}\) = Annual Net Operating Income
\(\text{Market Value of Property}\) = Current market value of the property
- Unlevered Return Metric: The Cap Rate represents an unlevered rate of return, meaning it doesn’t consider the impact of debt or other financing on the investment
- Evaluation Tool: Cap Rates are used to assess the potential return on an individual real estate property or to compare multiple properties. It provides a snapshot of the property’s potential profitability at a specific point in time.
आवेदन पत्र: For real estate investors, understanding the Cap Rate is crucial. It offers a straightforward way to gauge the potential return on an investment without the complexities of financing. By comparing Cap Rates of different properties, investors can make informed decisions about where to allocate their funds for the best potential returns.
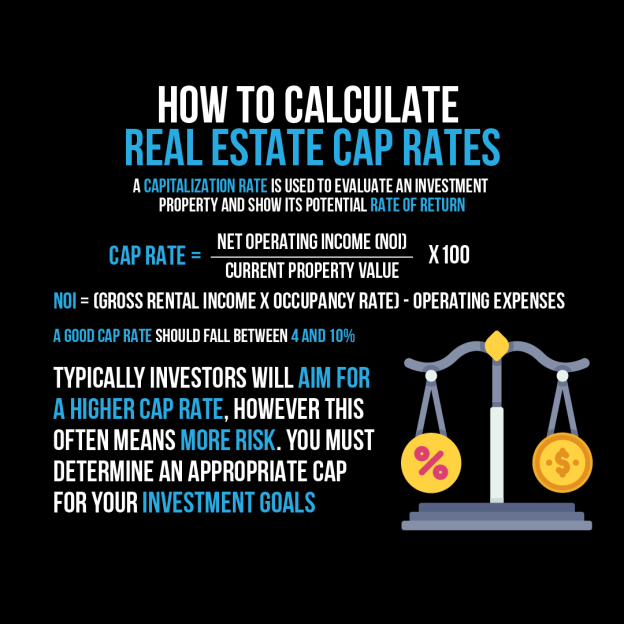
आकृति: The infographic provides a detailed guide on how to calculate real estate capitalization (cap) rates. It defines the cap rate as a metric used to assess an investment property’s potential rate of return. The formula for calculating the cap rate is given as the Net Operating Income (NOI) divided by the current property value. Additionally, the NOI is derived from the gross rental income adjusted for occupancy rate and subtracted by operating expenses. The infographic also advises that a desirable cap rate typically ranges between 4% and 10%. However, a higher cap rate might indicate increased risk, so investors should determine a cap rate that aligns with their investment objectives.
स्रोत: कस्टम इन्फोग्राफिक
Gross Rent Multiplier
Gross Rent Multiplier (GRM): This metric estimates the value of a rental property based on its gross rental income. The GRM is calculated by dividing the property’s purchase price by its annual gross rental income. For example, if a property is purchased for $500,000 and generates $100,000 in annual rental income, the GRM would be 5.
- पेशेवरों: Simple calculation, easy to compare properties
- दोष: Doesn’t account for operating expenses or vacancy rates
- सर्वोत्तम प्रथाएं: Use as a quick initial assessment before diving into more detailed analysis

आकृति: The infographic presents a formula to determine the Gross Rent Multiplier (GRM) in real estate. The GRM is calculated by dividing the sales price of a property by its potential rental income. This metric is useful for investors to evaluate the value of a property in relation to its rental income potential, helping them make informed investment decisions.
स्रोत: कस्टम इन्फोग्राफिक
Net Present Value
Net Present Value (NPV): This advanced method evaluates the potential return on a real estate investment by discounting future cash flows to their present value. The NPV is calculated by subtracting the initial investment from the present value of the property’s future cash flows.
- पेशेवरों: Considers the time value of money, accounts for varying cash flows over time
- दोष: Requires accurate cash flow projections, more complex calculation
- सर्वोत्तम प्रथाएं: Useful for comparing investments with different cash flow profiles and time horizons

चित्र का शीर्षक: Net Present Value (NPV) Calculation
स्रोत: Credit Donkey
विवरण: The image illustrates the formula and concept of the “Net Present Value (NPV)” calculation. It demonstrates how to compute the NPV for a cash flow of $2,500 with a discount rate of 0.0064.
चाबी छीनना:
- NPV is a method used to evaluate the profitability of an investment by determining the present value of expected future cash flows.
- The discount rate (0.0064 in this example) represents the opportunity cost of investing in the project.
- The formula takes into account the time value of money, meaning that a dollar received in the future is worth less than a dollar received today.
आवेदन: Understanding NPV is crucial for investors and financial analysts. It allows them to assess the potential profitability of an investment or project by comparing the present value of expected future cash flows to the initial investment. A positive NPV indicates that the projected earnings exceed the anticipated costs, making the investment potentially profitable.

चित्र का शीर्षक: Net Present Value (NPV) Calculation
स्रोत: Credit Donkey:
विवरण: The image illustrates the formula and concept of the “Net Present Value (NPV)” calculation. It demonstrates how to compute the NPV for a cash flow of $2,500 with a discount rate of 0.0064.
चाबी छीनना:
- NPV is a method used to evaluate the profitability of an investment by determining the present value of expected future cash flows.
- The discount rate (0.0064 in this example) represents the opportunity cost of investing in the project.
- The formula takes into account the time value of money, meaning that a dollar received in the future is worth less than a dollar received today.
आवेदन: Understanding NPV is crucial for investors and financial analysts. It allows them to assess the potential profitability of an investment or project by comparing the present value of expected future cash flows to the initial investment. A positive NPV indicates that the projected earnings exceed the anticipated costs, making the investment potentially profitable.

चित्रा शीर्षक: Understanding Net Present Value (NPV) in Real Estate Investment
स्रोत: Zilculator
विवरण: Net Present Value (NPV) is a critical valuation metric in real estate investment. If you’ve understood the concept of present value and discounted cash flow, NPV is a small step further. Essentially, NPV is the difference between the present value (PV) of all future cash flows and the amount of cash you invest to acquire those cash flows. This is why it’s termed “net” present value. For instance, if you require a 10.5% rate of return on your investment and you discount all expected future cash flows at that rate, the PV you derive is the amount you need to invest at 10.5% to achieve those future cash flows. If the PV of the cash flows is greater than your investment, you have a positive NPV, indicating your investment is yielding more than the specified rate of return. Conversely, if the PV is less than your investment, you have a negative NPV, implying you’re not meeting the specified rate of return.
चाबी छीनना:
- NPV Calculation: NPV is the difference between the PV of all future cash flows and the cash you invest to purchase those cash flows.
- Positive vs. Negative NPV: A positive NPV indicates you’re earning more than the specified rate of return, while a negative NPV suggests you’re not achieving the desired return.
- Excel Spreadsheet for NPV: Zilculator offers an Excel spreadsheet example to help users calculate NPV easily, eliminating the need for manual calculations.
आवेदन: Understanding NPV is vital for real estate investors as it provides a clear picture of the profitability of an investment. It allows investors to assess whether they are achieving their desired rate of return based on the present value of expected future cash flows. By using tools like the provided Excel spreadsheet, investors can simplify the calculation process and make informed investment decisions.
Internal Rate of Return
Internal Rate of Return (IRR): This advanced metric calculates the discount rate that makes the net present value of the property’s future cash flows equal to zero. The IRR is a useful metric for comparing the potential returns of different real estate investments with different cash flows over time.
- पेशेवरों: Considers the time value of money, useful for comparing investments
- दोष: Requires accurate cash flow projections, complex calculation
- सर्वोत्तम प्रथाएं: Use in conjunction with other metrics for a comprehensive investment analysis

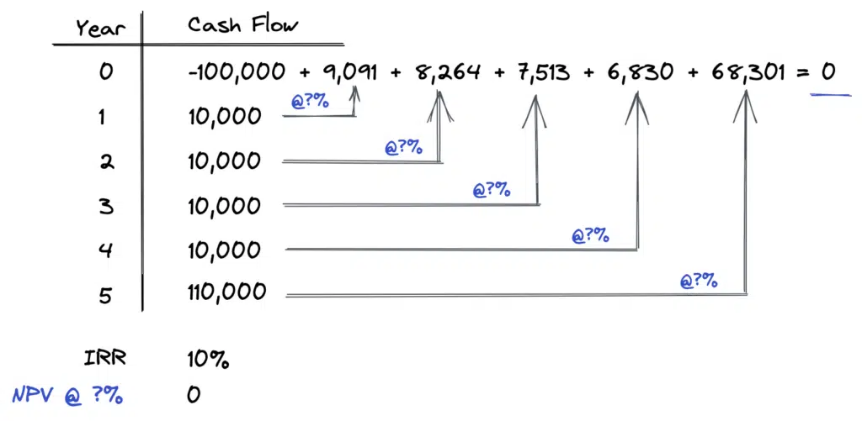
चित्र का शीर्षक: Understanding the Internal Rate of Return (IRR) in Investments
स्रोत: PropertyMetrics
विवरण: The Internal Rate of Return (IRR) is a pivotal financial metric employed to gauge the performance of an investment. It represents the interest rate at which the net present value (NPV) of all cash flows from a particular project equals zero. In simpler terms, the IRR can be viewed as the percentage rate earned on each dollar invested for every period it remains invested.
चाबी छीनना:
- IRR Formula: The IRR seeks the interest rate that results in a net present value of zero. This is intrinsically linked to the concept of Net Present Value (NPV), which is the difference between the present value of incoming and outgoing cash.
- NPV Definition: NPV represents the present value of all incoming cash (benefits) minus the present value of all outgoing cash (costs).
- IRR Calculation: Typically determined through a trial and error method, the IRR involves iterative guesses of different interest rates in its formula until a rate is identified that results in a net present value of zero.
आवेदन: Understanding the IRR is crucial for investors as it provides a clear metric to evaluate the potential profitability of an investment. It allows investors to determine the percentage rate of return they can expect for their investment over time. Modern tools, such as financial calculators or Excel’s IRR function, have simplified the calculation process, enabling investors to make informed decisions more efficiently.
II. Estimating Rental Income and Expenses

आकृति: A visual representation emphasizing the concept of “Rental Income,” highlighting the financial aspects of property leasing and its potential returns.
स्रोत: iStockफोटो
Research Local Rental Market: Gather data on comparable rental rates by using rental listing websites, local newspapers, and real estate agents. Consider factors such as location, size, amenities, and property condition when estimating potential rental income.
Factor in Expenses: Accurately estimate expenses associated with owning and managing a rental property, including property taxes, insurance, maintenance and repairs, property management fees, and utilities.
Operating Costs: Account for ongoing expenses related to running the rental property, such as property management fees, cleaning, landscaping, and marketing expenses.
Use a Pro Forma: Create a financial statement that estimates future income and expenses for a property. Include estimated rental income, expenses, and operating costs to provide a more accurate picture of the property’s financial performance.
चित्र का शीर्षक: Rental Property Cash Flow Analysis
स्रोत: PropertyMetrics:
III. Analyzing Cash Flow
परिचय
Cash flow is a critical component of any real estate investment, as it determines the profitability and sustainability of the investment over time. Properly analyzing cash flow can help investors make informed decisions about their investments and ensure they generate a positive return. In this chapter, we will cover the basics of cash flow analysis, discuss key metrics and calculations, and provide examples to help you understand the process.
What is Cash Flow?
Cash flow refers to the amount of money that is generated by a real estate investment after accounting for all income and expenses associated with the property. Positive cash flow occurs when the income generated by the property exceeds its expenses, while negative cash flow occurs when expenses exceed income. Analyzing cash flow is essential to determining the overall health of a real estate investment and whether it will provide a consistent and reliable source of income for the investor.
Key Metrics and Calculations
There are several key metrics and calculations that investors can use to analyze cash flow in real estate investments, including:
Gross rental income: The total income generated by a property from rents. This is typically calculated on a monthly or annual basis.
- उदाहरण: A property with two units rented for $1,000 each per month would generate a gross rental income of $2,000 per month or $24,000 per year.
Operating expenses: The costs associated with owning and managing a property, such as property taxes, insurance, utilities, maintenance, property management fees, and vacancy allowances.
- उदाहरण: A property with annual operating expenses of $8,000 would have monthly operating expenses of approximately $667 ($8,000 ÷ 12).

विवरण: The infographic outlines the various operating expenses associated with real estate investments, providing clarity on the costs that affect the net income from property assets.
चाबी छीनना:
- Expense Categories: It details different types of operating expenses such as maintenance, management fees, taxes, and insurance.
- बजट: Highlights the necessity for investors to account for these expenses in their financial planning to ensure accurate yield calculations.
- Cost Management: Understanding these expenses is crucial for effective cost control and maximization of net operating income.
आवेदन: Investors can apply this knowledge to perform more accurate cash flow analyses and improve the profitability of their real estate investments by managing and potentially reducing operating expenses.
Operating Expense Ratio
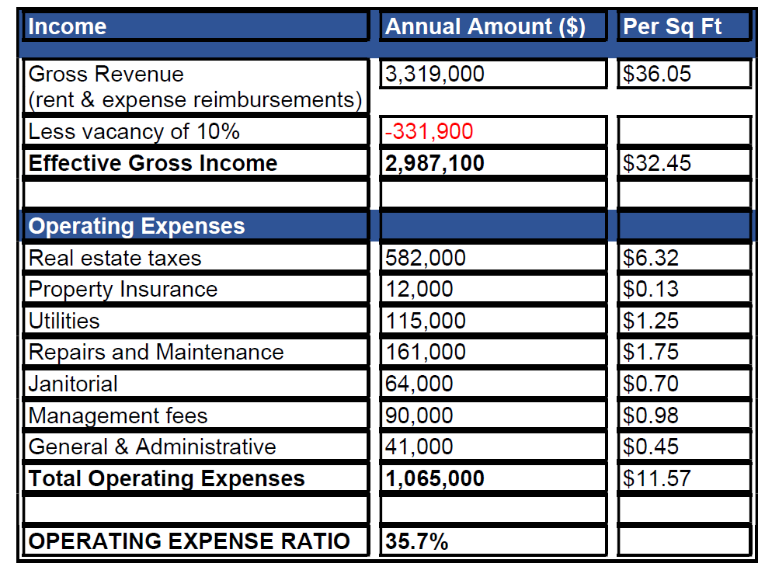
चित्र का शीर्षक: Calculating and Understanding the Operating Expense Ratio (OER) in Real Estate
स्रोत: BullpenRE
विवरण: The Operating Expense Ratio (OER) is a fundamental metric that showcases how efficiently a property operates on a daily basis. It represents the portion of the rental income (after accounting for vacancies) that is consumed by the property’s operating expenses. The formula for OER is given by: dividing all operating expenses less depreciation by operating income.
Typical operating expenses for commercial real estate include real estate taxes, property insurance, utilities, repairs and maintenance, janitorial services, property management fees, general & administrative fees, advertising and marketing fees, and payroll.
चाबी छीनना:
- OER’s Significance: A lower OER generally indicates a well-managed property, while a higher OER can suggest potential areas for improvement.
- Effective Gross Income (EGI): EGI is preferred over Total Potential Income as it considers property vacancies, which can impact the ability to cover operating costs.
- Different Property Types: Different types of properties, such as multifamily, office, retail, industrial, and hotels, have varying typical OER ranges due to their distinct expense structures.
आवेदन: The OER provides valuable insights into the operational efficiency of a property. By comparing the OER of different properties or tracking the OER of a single property over time, investors can identify trends, potential areas for cost savings, and overall investment performance. However, it’s essential to use OER in conjunction with other metrics, like the capitalization rate, to get a comprehensive view of a property’s market value and profitability
Net Operating Income
Net operating income (NOI): The income generated by a property after deducting operating expenses. This can be calculated using the following formula:
\(\textbf{NOI Equation:}\)
\[ \displaystyle \text{NOI} = \text{Gross rental income} – \text{Operating expenses} \]
\(\textbf{किंवदंती:}\)
\(\text{NOI}\) = Net Operating Income
\(\text{Gross rental income}\) = Total rental income before expenses
\(\text{Operating expenses}\) = Costs associated with operating the property
Example: Using the figures from our previous examples, the NOI for the property would be $1,333 per month ($2,000 – $667) or $16,000 per year ($24,000 – $8,000).
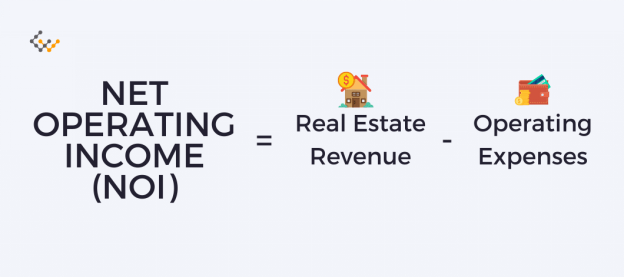
आकृति: The infographic illustrates the formula to compute the Net Operating Income (NOI) in real estate. NOI is determined by subtracting operating expenses from the real estate operating revenue. This metric is pivotal for investors as it provides insight into the profitability of a property before considering financing costs, making it a key indicator of a property’s financial health.
स्रोत: कस्टम इन्फोग्राफिक
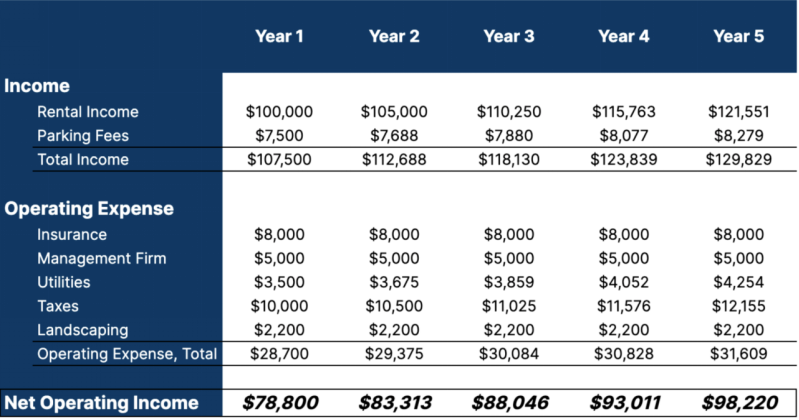
चित्रा शीर्षक: Understanding Net Operating Income (NOI) in Real Estate Investment
स्रोत: Equity Multiple
विवरण: Net Operating Income (NOI) is a foundational metric in real estate investment that provides insights into the profitability of a property. It is calculated by determining the total income generated by the property and then subtracting all the operating expenses. The resulting figure gives investors a clear picture of the property’s operational profitability, excluding any financing or capital expenses.
चाबी छीनना:
\(\textbf{NOI Formula:}\)
\[ \displaystyle \text{NOI} = \text{Total Income} – \text{Total Operating Expenses} \]
\(\textbf{किंवदंती:}\)
\(\text{NOI}\) = Net Operating Income
\(\text{Total Income}\) = Total income from the property
\(\text{Total Operating Expenses}\) = Total operating expenses for the property
- Significance of NOI: NOI offers a pure view of a property’s operational performance, devoid of the influence of financing or other non-operational factors.
- Critical for Investment Decisions: NOI is a primary metric that investors look at when assessing the viability and profitability of a real estate investment
आवेदन: Understanding NOI is crucial for real estate investors as it provides a clear metric to evaluate the operational profitability of a property. By comparing the NOI of different properties or tracking the NOI of a single property over time, investors can identify trends and make informed investment decisions. It’s essential to use NOI in conjunction with other metrics to get a comprehensive view of a property’s financial health and potential returns.
Debt Service
Debt service: The monthly or annual cost of any financing used to purchase the property, such as mortgage payments.
- उदाहरण: If the property was purchased with a $150,000 mortgage with a 4% interest rate and a 30-year term, the monthly debt service would be approximately $716.

Figure title: Debt Service Coverage Ratio (DSCR) Calculation
स्रोत: Investopedia
विवरण: This infographic demonstrates the formula and process for calculating the Debt Service Coverage Ratio (DSCR), a key metric used by lenders to assess a borrower’s ability to repay debt.
चाबी छीनना:
- Formula Insight: It explains the DSCR formula, which is Net Operating Income (NOI) divided by Total Debt Service.
- Financial Health Indicator: DSCR is a critical indicator of financial health, showing whether the income from an investment is sufficient to cover the debt payments.
- Threshold for Lending: A DSCR of less than 1 indicates insufficient income to cover debt service, potentially influencing lenders’ decisions
आवेदन पत्र: Investors and borrowers can use the DSCR to gauge the safety margin they have on their income versus debt obligations, which is vital for securing loans and managing financial risks.
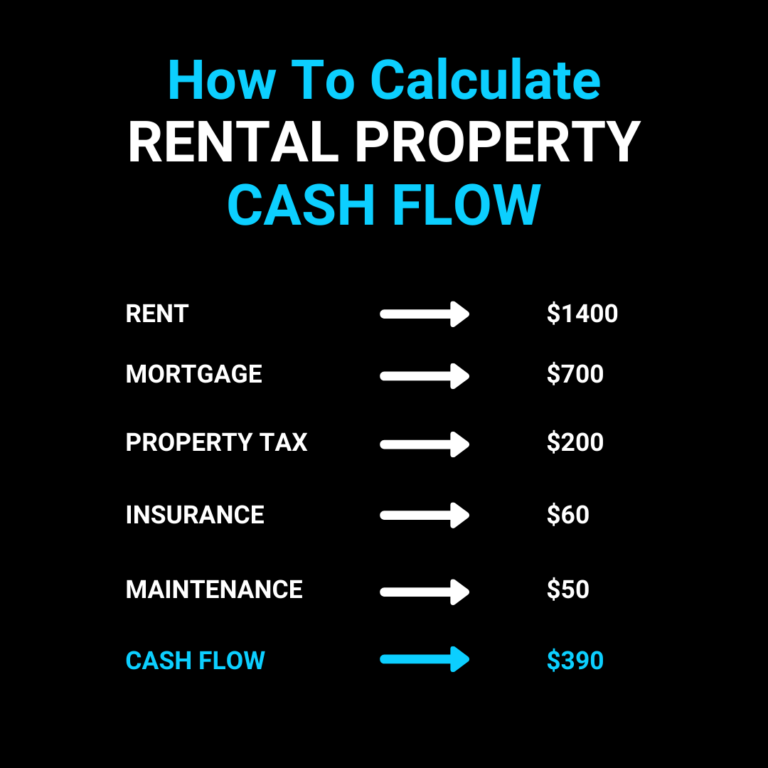
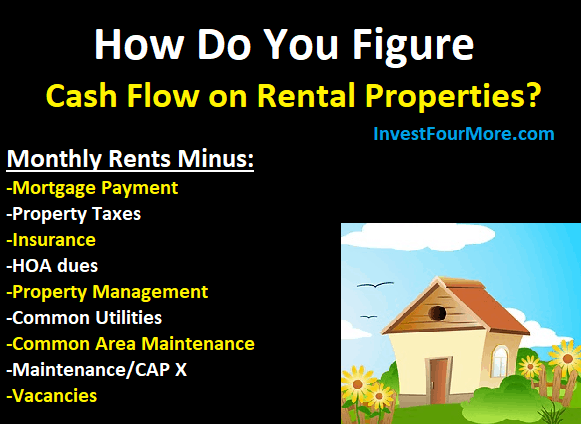
आकृति: This infographic, titled “How To Calculate Rental Property Cash Flow,” provides a straightforward and practical guide for calculating the cash flow from a rental property. It breaks down the process into simple steps, listing typical expenses such as rent, mortgage, property tax, insurance, and maintenance, and then demonstrates how to calculate the net cash flow. For example, with a rent of $1400, mortgage $700, property tax $200, insurance $60, and maintenance $50, the cash flow would be $390. This is a valuable tool for anyone involved in real estate investment, particularly beginners, as it simplifies the process of understanding and managing rental property finances.
स्रोत: कस्टम इन्फोग्राफिक
नकदी प्रवाह
Cash flow: The amount of money remaining after all expenses and debt service have been accounted for. This can be calculated using the following formula:
\(\textbf{Cash Flow Equation:}\)
\[ \displaystyle \text{Cash flow} = \text{NOI} – \text{Debt service} \]
\(\textbf{किंवदंती:}\)
\(\text{Cash flow}\) = Net cash flow
\(\text{NOI}\) = Net Operating Income
\(\text{Debt service}\) = Debt service (loan payments)
- उदाहरण: Using the figures from our previous examples, the cash flow for the property would be $617 per month ($1,333 – $716) or $7,404 per year ($16,000 – $8,592).
Analyzing Cash Flow
When analyzing cash flow, it’s important to consider the following factors:
- Ensure positive cash flow: A positive cash flow is crucial for a successful real estate investment, as it provides a steady source of income and allows the investor to cover expenses, pay down debt, and potentially reinvest in additional properties.
- Consider potential changes in income and expenses: It’s important to analyze how changes in rental rates, vacancy rates, and operating expenses could impact cash flow. This will help you make informed decisions about rent increases, property improvements, and other factors that could affect cash flow.
- Evaluate cash-on-cash return: Cash-on-cash return is a metric used to evaluate the return on investment based on the cash flow generated by a property compared to the amount of cash initially invested (i.e., down payment and closing costs). A higher cash-on-cash return indicates a more profitable investment.
\(\textbf{Cash-on-Cash Return Formula:}\)
\[ \displaystyle \text{Cash-on-cash return} = \left(\frac{\text{Annual cash flow}}{\text{Cash invested}}\right) \times 100 \]
\(\textbf{किंवदंती:}\)
\(\text{Cash-on-cash return}\) = Cash-on-cash return
\(\text{Annual cash flow}\) = Annual cash flow
\(\text{Cash invested}\) = Cash invested
- उदाहरण: If the initial cash investment for the property was $40,000 (down payment and closing costs), the cash-on-cash return would be 18.51% ($7,404 ÷ $40,000 x 100).
- Project future cash flow growth: By analyzing historical data and market trends, investors can project the potential growth of cash flow over time. This can help in determining the long-term viability and profitability of the investment.
- Evaluate the impact of tax benefits and deductions: Real estate investments often come with tax benefits, such as depreciation, which can offset income and lower taxable income. Be sure to consider the impact of these benefits when analyzing cash flow.
- Use cash flow analysis to compare different investment properties: By analyzing the cash flow of multiple properties, investors can make informed decisions about which properties offer the best return on investment and the most favorable cash flow situation.
निष्कर्ष
Analyzing cash flow is an essential step in the evaluation of real estate investments. By understanding the key metrics and calculations involved in cash flow analysis, investors can make informed decisions about their investments and ensure they generate a positive return. With a detailed understanding of cash flow, investors can confidently navigate the world of real estate investing and build a successful and profitable portfolio.
चाबी छीनना:
बंद बयान: Leverage, when wielded judiciously, emerges as a potent tool in the real estate investment realm, amplifying buying power and potential returns. This section equips investors with a comprehensive understanding of both the power and perils of leveraging, guiding them to make informed choices and implement risk mitigation strategies effectively.
- Essence of Leverage: Borrowed capital, predominantly in the form of mortgages, allows investors to finance their real estate ventures, hoping the ensuing profits surpass borrowing costs.
- Power of Leverage: It unlocks avenues for increased purchasing capacity, opportunities for diversification, enticing tax breaks, augmented returns, and improved liquidity.
- Risks Inherent: Despite its allure, high leverage levels can introduce risks like constricted cash flow, vulnerability to interest rate hikes, exposure to market downturns, diminished investment agility, and an elevated chance of default.
- Strategies for Mitigating Risks: Prudent risk management is paramount. Ensuring sufficient cash reserves, investment diversification, moderate leveraging, opting for long-term financing, seeking professional property management, routine property checks, and adequate insurance coverage are pivotal strategies to safeguard investments.
- Holistic Approach: While the potential rewards of leverage are tempting, investors must exercise caution, constantly evaluating market conditions, personal financial health, and the specific details of their financing arrangements to ensure sustainable and profitable investment trajectories.
