
Introduzione ai cicli di mercato
Obiettivi chiave di apprendimento:
Introduzione: This section delves into the intricacies of the housing market cycles. Understanding these cyclical patterns, influenced by various external factors, is paramount for any real estate investor. As you journey through this section, you’ll gain insights into the phases of the housing market and how they can impact investment strategies.
- Comprehend the significance of understanding the housing market cycle for real estate investors.
- Identify and understand the four main phases of the housing market cycle.
- Recognize the external factors influencing these phases, such as government policies and economic conditions.
- Analyze the characteristics and economic conditions that define each phase.
- Examine historical examples that illustrate the behavior of each phase in the housing market cycle.
- Apply knowledge of each phase to make informed investment decisions.
- Understand how to use charts and data to analyze and anticipate housing market trends.
Understanding the housing market cycle is crucial for real estate investors, as it allows them to make informed decisions about when to buy, sell, or hold properties. In this chapter, we will explain the housing market cycle in simple terms, discuss its different stages, and provide historical examples to illustrate the characteristics and economic conditions of each stage. We will also offer tips on what investors should do during these various phases.
I. The Housing Market Cycle
The housing market cycle consists of four main phases: recovery, expansion, hyper-supply, and recession. These phases can be influenced by various factors, including government policies, economic conditions, and market sentiment. By recognizing the current phase of the housing market cycle, investors can better anticipate changes in property values and make more informed decisions.

Titolo della figura: Canadian Real Estate Market Cycles
Fonte: Better Dwelling
Descrizione: The chart presents an overview of the typical cycles observed in the Canadian real estate market. It breaks down the market into four distinct phases: recovery, expansion, hypersupply, and recession. Each phase is characterized by specific trends in construction, unemployment, public interest, and housing prices.
Punti chiave:
- Recovery Phase: Characterized by high unemployment, halted construction, and minimal public interest in real estate. In Toronto, this phase spanned from 1993 to 2008.
- Expansion Phase: This phase sees an uptick in construction, declining unemployment, and a generally thriving economy. Toronto experienced this phase until around 2015-2016.
- Hypersupply Phase: This is when construction significantly overshoots demand. Toronto is currently in this phase, with over 70,000 housing units under construction.
- Recession Phase: High home prices lead to reduced disposable income, impacting businesses and leading to increased unemployment and reduced economic opportunities.
Applicazione: Recognizing and understanding these market cycles is crucial for investors, policymakers, and homeowners. It provides insights into potential future trends, allowing for informed decision-making. For instance, during the hypersupply phase, potential homebuyers might benefit from waiting for prices to stabilize or drop. On the other hand, developers and investors can strategize their investments based on the anticipated demand and supply in each phase.
A. Recovery Phase
Characteristics: The recovery phase begins when the market starts to stabilize after a recession. During this stage, vacancies decrease, rents and property values begin to rise, and new construction is limited.
Economic conditions: The recovery phase is often supported by government policies, such as low interest rates, which encourage borrowing and investment. Increased demand for goods and services leads to job creation and economic growth.
Historical examples:
- The early 1990s: Following the savings and loan crisis, the U.S. housing market entered a period of recovery, characterized by lower interest rates and a gradual increase in property values.
- The early 2000s: After the dot-com bubble burst, the housing market experienced another recovery phase, fueled by low interest rates and government policies that encouraged homeownership.
- The post-2008 financial crisis: The housing market recovery following the 2008 crash was marked by historically low interest rates, government interventions, and a slow rebound in property values.
Tips for investors during the recovery phase:
- Look for opportunities to invest in undervalued properties.
- Focus on markets with strong economic growth and job creation.
- Be patient and prepared to hold properties for the long term.
B. Expansion Phase
Characteristics: During the expansion phase, occupancy rates exceed long-term averages, and rents and property values continue to rise. New construction increases as developers and investors seek to capitalize on growing demand.
Economic conditions: The expansion phase is marked by strong economic growth, low unemployment, and increased consumer spending.
Historical examples:
- The mid-to-late 1990s: The U.S. housing market experienced significant expansion during the 1990s, driven by a strong economy and increased demand for housing.
- The mid-2000s: The housing market expansion in the mid-2000s was characterized by easy access to credit, subprime lending, and a rapid increase in property values.
- The early 2010s: The expansion phase following the 2008 financial crisis saw a resurgence in the housing market, driven by low interest rates and a strong economy.
Tips for investors during the expansion phase:
- Invest in properties with strong rental growth potential.
- Monitor market conditions closely to anticipate shifts in supply and demand.
- Be cautious about over-leveraging and consider potential risks.
C. Hyper-supply Phase
Characteristics: The hyper-supply phase occurs when an oversupply of properties leads to increased vacancies, slowing rent growth, and stagnant or declining property values.
Economic conditions: The hyper-supply phase typically coincides with an economic slowdown, which can be caused by various factors, such as rising interest rates or decreased consumer spending.
Historical examples:
- The late 1980s: The U.S. housing market experienced a hyper-supply phase in the late 1980s, driven by overbuilding and an economic slowdown.
- The late 2000s: The housing market crash of 2008 was preceded by a hyper-supply phase, characterized by overbuilding, subprime lending, and an eventual decline in property values.
- The late 2010s: Some markets experienced localized hyper-supply phases in the late 2010s, with an oversupply of luxury condominiums and apartments leading to increased vacancies and stagnant property values.
Tips for investors during the hyper-supply phase:
- Be cautious about investing in new construction projects, as oversupply can lead to declining property values.
- Consider selling properties that may be at risk of losing value or becoming difficult to rent.
- Focus on maintaining existing properties and securing reliable tenants.
D. Recession Phase
Characteristics: The recession phase is marked by a decrease in demand for properties, leading to increased vacancies, falling rents, and declining property values.
Economic conditions: The recession phase typically coincides with an overall economic downturn, which can be caused by factors such as high unemployment, reduced consumer spending, or a tightening of credit.
Historical examples:
- The early 1980s: The U.S. housing market experienced a recession in the early 1980s, driven by high interest rates, high inflation, and an economic downturn.
- The early 1990s: The savings and loan crisis led to a housing market recession in the early 1990s, characterized by increased foreclosures and declining property values.
- The late 2000s: The 2008 financial crisis resulted in a severe housing market recession, with widespread foreclosures, plummeting property values, and a global economic downturn.
Tips for investors during the recession phase:
- Be prepared for potential declines in property values and rental income.
- Focus on preserving capital and maintaining a conservative investment strategy.
- Look for opportunities to acquire distressed properties at a discount, but be cautious about the risks involved. RR
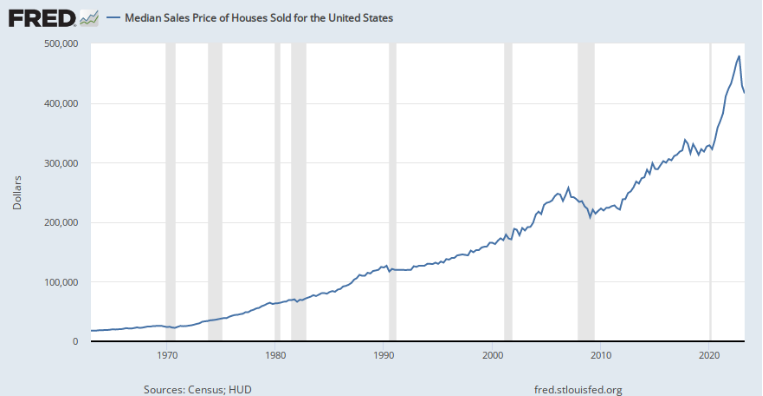
Titolo della figura: Median Sales Price of Houses Sold in the United States Over Time
Descrizione: The figure illustrates the trend of the median sales price of houses sold in the United States from 1963 until now. The line chart shows an overall upward trajectory, although there are some fluctuations and periods of relative stability.
Punti chiave:
- The median sales price of houses in the U.S. has generally been rising since 1963.
- There are visible fluctuations in the price, indicating periods of economic booms and recessions.
- More recent years have seen a significant uptick in the median sales price, suggesting increased demand or housing market dynamics
Applicazione: Understanding historical housing price trends can help investors make informed decisions about the real estate market. For instance, identifying periods of rapid growth or stagnation can offer insights into potential future market dynamics. Moreover, this data is useful for comparing housing price growth relative to other economic indicators, providing a holistic view of the nation’s economic health

Titolo della figura: U.S. Home Price Growth Over 50 Years
Fonte: Capitalista visivo
Descrizione: The figure showcases the growth of U.S. home prices over a span of 50 years, comparing nominal versus real home prices from 1971 to 2022. In Q4 2022, real home prices experienced their slowest annual growth in a decade due to high inflation and increasing mortgage rates, even with a record-low inventory. The graph indicates that nominal price growth reached its peak in Q1 2022, rising by 19.5% annually. The housing market’s sensitivity to rates is emphasized, and in real terms, price growth saw significant reductions as mortgage applications approached multi-decade lows. The 1970s witnessed a surge in real prices due to the baby boom driving housing demand. However, real prices took a nosedive in 2008 as the market was flooded with subprime mortgage properties. The total housing supply is currently less than half the average of the past four decades. Despite the slowdown in price growth, nominal prices remain 42% above pre-pandemic levels.
Punti chiave:
- Real home prices in Q4 2022 saw their slowest growth in a decade
- Nominal price growth peaked in Q1 2022, with a 19.5% annual rise.
- IL housing market is highly sensitive to rate changes.
- Real prices faced significant reductions as mortgage applications neared historic lows.
- IL baby boom in the 1970s drove up real prices.
- Real prices drastically dropped in 2008 due to an influx of subprime mortgage properties.
Applicazione: Understanding the historical trends of home price growth can be invaluable for investors and potential homeowners. Recognizing the factors that influence these trends, such as inflation, mortgage rates, and housing demand, can aid in making informed decisions about property investments. For those learning about investing, this data provides insights into the cyclical nature of the housing market and the external factors that can impact it.
History Of US Price Growth
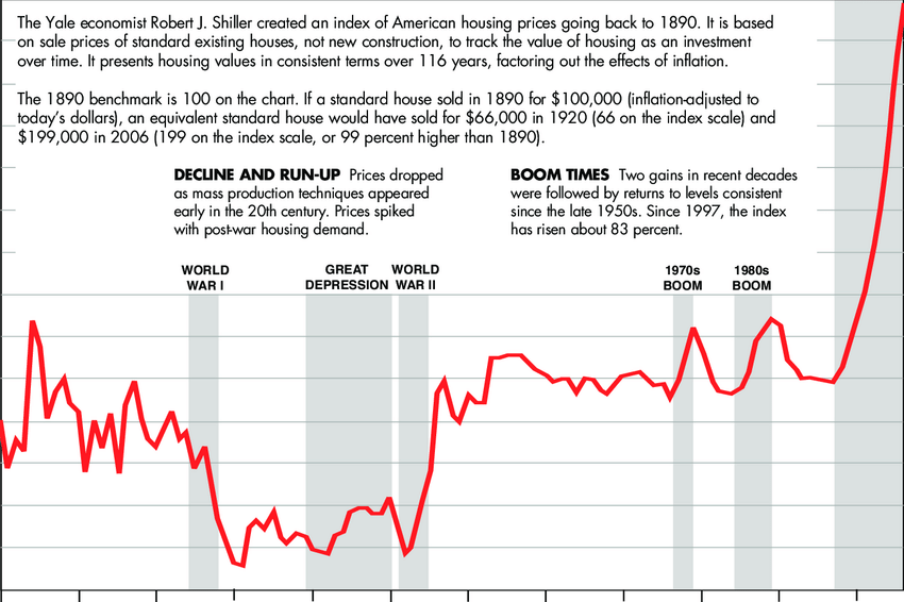
Titolo della figura: American housing prices over 116 years removing the effects of inflation.
Fonte: Research Gate
1. World War 1 (1914-1918):
- Impact: The U.S. entered World War I in 1917, and the war had a mixed impact on the housing market. Initially, there was a slowdown in construction due to labor and material shortages. However, as the war progressed, there was a surge in demand for housing near military bases and war-related industries.
- Recovery: Post-war, there was a brief recession in 1918-1919, but the economy and the housing market rebounded quickly. The 1920s saw a significant housing boom, driven by post-war optimism, easy credit, and urbanization.
- Market Impact: While the war initially slowed down real estate activities, the post-war period saw a surge in prices and construction, especially in urban areas.
2. Great Depression (1929-1939):
- Impact: The stock market crash of 1929 led to the Great Depression, which had a devastating effect on the U.S. housing market. Property values plummeted, construction came to a near halt, and many homeowners facing foreclosure.
- Recovery: The New Deal programs introduced by President Franklin D. Roosevelt in the 1930s, such as the Home Owners’ Loan Corporation (HOLC) and the Federal Housing Administration (FHA), played a significant role in stabilizing the housing market.
- Market Impact: Real estate prices dropped significantly during the depression, but government interventions helped prevent a complete collapse of the market.
3. World War 2 (1939-1945):
- Impact: The U.S. entry into World War II in 1941 led to a halt in civilian construction. Labor and materials were diverted to the war effort.
- Recovery: After the war, there was a massive demand for housing from returning veterans. The G.I. Bill provided loans to veterans, leading to a housing boom in the late 1940s and 1950s.
- Market Impact: The immediate post-war years saw a surge in housing demand and prices, driven by government policies and the economic boom.
4. 1970s Boom:
- Impact: The 1970s saw significant inflation and economic challenges. However, the housing market experienced a boom, driven by demographic factors like the baby boomers entering the housing market.
- Recovery: The boom was followed by a slowdown in the late 1970s due to high-interest rates.
- Market Impact: Real estate prices rose during the decade, but the high-interest rates towards the end of the 1970s slowed down the market.
5. 1980s Boom:
- Impact: The early 1980s saw a recession and high-interest rates, which impacted the housing market. However, as interest rates started to decline, there was a significant boom in the housing market in the mid to late 1980s.
- Recovery: The boom was followed by a slowdown in the early 1990s due to economic factors and overbuilding during the boom years.
- Market Impact: The 1980s saw significant fluctuations in the housing market, with a boom in the mid to late 1980s followed by a slowdown towards the end of the decade.
- Impact: The early 1980s saw a recession and high-interest rates, which impacted the housing market. However, as interest rates started to decline, there was a significant boom in the housing market in the mid to late 1980s.
- Impact: The 1970s saw significant inflation and economic challenges. However, the housing market experienced a boom, driven by demographic factors like the baby boomers entering the housing market.
- Impact: The U.S. entry into World War II in 1941 led to a halt in civilian construction. Labor and materials were diverted to the war effort.
- Impact: The stock market crash of 1929 led to the Great Depression, which had a devastating effect on the U.S. housing market. Property values plummeted, construction came to a near halt, and many homeowners facing foreclosure.
- Impact: The U.S. entered World War I in 1917, and the war had a mixed impact on the housing market. Initially, there was a slowdown in construction due to labor and material shortages. However, as the war progressed, there was a surge in demand for housing near military bases and war-related industries.
Conclusione
Understanding the housing market cycle is essential for real estate investors who want to make informed decisions about when to buy, sell, or hold properties. By recognizing the characteristics and economic conditions of each phase, investors can better anticipate changes in the market and adjust their strategies accordingly. By studying historical examples and following the tips provided for each phase, investors can maximize their returns and minimize their risks throughout the housing market cycle.
Punti chiave:
Dichiarazione di chiusura: The dynamism of the housing market, with its cyclical ebb and flow, necessitates a comprehensive understanding for fruitful investments. This section provides the foundational knowledge to not only recognize these cycles but to also strategically navigate them. Harnessing this understanding empowers investors to seize opportunities and mitigate potential risks in the ever-evolving real estate landscape.
- Housing Market Cycle Overview: The housing market cycle comprises four main phases: recovery, expansion, hyper-supply, and recession.
- Recovery Phase:
- Characteristics: Stability after recession, decreasing vacancies, rising rents and property values, limited new construction.
- Economic Conditions: Often supported by government policies like low interest rates and job creation.
- Action: Investors should look for undervalued properties in markets with strong economic growth.
- Expansion Phase:
- Characteristics: Rising occupancy rates, property values, and new construction.
- Economic Conditions: Marked by strong economic growth and increased consumer spending.
- Action: Investors should invest in properties with potential rental growth and monitor market conditions.
- Hyper-supply Phase:
- Characteristics: Oversupply, increased vacancies, slowing rent growth, stagnant/declining property values.
- Economic Conditions: Typically coincides with economic slowdowns.
- Action: Investors should be wary of new construction and consider selling properties at risk of devaluation.
- Recession Phase:
- Characteristics: Decreased demand, increased vacancies, falling rents, and property values.
- Economic Conditions: Coincides with economic downturns.
- Action: Investors should conserve capital, maintain conservative strategies, and look for opportunities to buy distressed properties.
- Historical Analysis: Analyzing past events, such as World Wars, the Great Depression, and various economic booms, provides valuable insights into the cyclical nature of the housing market.
- Application of Knowledge: Recognizing and understanding market cycles is vital for various stakeholders, including investors, policymakers, and homeowners, as it allows for strategic planning and decision-making.
