
Rischio e rendimento: Beta, Alpha e l'indice di Sharpe
Obiettivi chiave di apprendimento:
Introduzione: This section unveils the fundamental financial metrics such as Beta, Alpha, and the Sharpe Ratio, essential for evaluating the performance of investments. Understanding these metrics aids in better portfolio evaluation and broadens your comprehension of factors influencing risk and return.
- Decipher Financial Metrics: Uncover the fundamental concepts of finance, notably beta, alpha, and the Sharpe ratio, vital for evaluating the performance of investments.
- Enhance Portfolio Evaluation: By grasping these key metrics, you can more effectively assess your portfolio’s risk and potential return, paving the way for more informed investment decisions.
- Broaden Risk Understanding: Recognize the broader factors, from diversification to investment horizon, influencing risk and return.
12.1 Introduction
In this chapter, we will discuss risk and return, which are fundamental concepts in finance. We will cover beta, alpha, and the Sharpe ratio, and explain their importance in evaluating investment performance. We will also discuss other key factors to consider when assessing risk and return. Let’s get started!
12.2 Beta
Beta is a measure of a stock’s volatility compared to the overall market. A beta of 1 indicates that a stock’s price moves in line with the market, while a beta greater than 1 signifies higher volatility, and a beta less than 1 indicates lower volatility.
Esempio:
Stock A has a beta of 1.5, which means it is 50% more volatile than the market. If the market goes up by 10%, we can expect Stock A to go up by 15% (10% * 1.5).

Figure title: Understanding Stock Beta
Fonte: Business Insider
Descrizione: The figure introduces the formula used to calculate the beta of a stock. Essentially, beta measures a stock’s volatility in relation to the overall market. It helps in identifying whether a stock has a tendency to move more or less than the broader market.
Punti chiave:
- Understanding Beta Values: A beta greater than 1 indicates higher volatility than the market, a beta of 1 suggests a volatility equal to the market, and a beta less than 1 points to a volatility lower than the market.
- Correlation Factor: Beta can also be viewed as the correlation between an individual stock’s returns and the market’s returns.
Applicazione: Knowing the beta of a stock is instrumental for investors to gauge the risk associated with it. By comparing a stock’s beta to the market’s benchmark, investors can make more informed decisions about the inherent risk of their portfolios and adjust their investment strategies accordingly.
12.3 Alpha
Alpha is a measure of a stock’s performance relative to its benchmark, such as the S&P 500. A positive alpha indicates that a stock has outperformed its benchmark, while a negative alpha signifies underperformance.
Esempio:
Stock B has an alpha of 3, which means it has outperformed its benchmark by 3 percentage points.
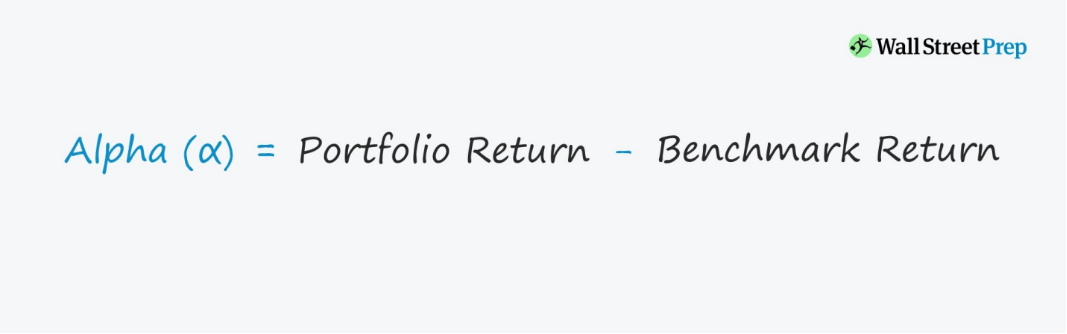
Figure title: Understanding Portfolio Alpha
Fonte: Wall Street Prep
Descrizione: The figure elucidates the formula used to compute the alpha of a portfolio. Alpha is a metric that quantifies the performance of a portfolio relative to a benchmark.
Punti chiave:
- Alpha Calculation: Alpha is derived by subtracting the benchmark return from the portfolio return.
- Interpretation of Alpha:
- Positive Alpha: A positive alpha indicates that the portfolio has outperformed its benchmark.
- Negative Alpha: A negative alpha suggests that the portfolio has underperformed compared to its benchmark.
Applicazione: Alpha is an essential tool for investors and portfolio managers. It provides insights into the ability of the portfolio manager to generate returns over and above a benchmark, after adjusting for risk. Thus, it serves as a measure of the manager’s value-add or performance.
12.4 Sharpe Ratio
The Sharpe ratio measures the risk-adjusted return of an investment. It is calculated by dividing the excess return of an investment (its return minus the risk-free rate) by its volatility or standard deviation. A higher Sharpe ratio indicates better risk-adjusted performance.
Esempio:
Stock C has an average return of 12%, a standard deviation of 15%, and the risk-free rate is 2%. The Sharpe ratio for Stock C can be calculated as:
Sharpe Ratio = (12% – 2%) / 15% = 0.67
\(\textbf{Sharpe Ratio Calculation:}\)
\[ \displaystyle \text{Sharpe Ratio} = \frac{12\% – 2\%}{15\%} = 0.67 \]
\(\textbf{Legend:}\)
\(\text{Sharpe Ratio}\) = Sharpe Ratio
\(12\%\) = Expected portfolio return
\(2\%\) = Risk-free rate
\(15\%\) = Standard deviation of the portfolio’s excess return

Figure title: Understanding the Sharpe Ratio
Fonte: Business Insider
Descrizione: The Sharpe Ratio is a measure that helps investors understand the risk-adjusted performance of an investment or portfolio. It is a tool to quantify how much excess return one receives for the extra volatility of holding a riskier asset.
Punti chiave:
- Numerator: Represents the portfolio’s excess return over the risk-free rate.
- Denominator: Accounts for the risk of the portfolio, represented by its standard deviation or volatility.
- Interpretation:
- A higher Sharpe Ratio implies that the investment provides a better return for its level of risk. Conversely, a lower Sharpe Ratio can suggest that the risk taken is not justified by the returns.
Applicazione: The Sharpe Ratio is valuable for investors because it offers a holistic view of an investment’s performance. By considering both return and volatility, it provides a more comprehensive picture than looking at returns alone. It’s particularly useful when comparing the risk-adjusted returns of different investments or portfolios.
12.5 Other Factors to Consider
When assessing risk and return, it is essential to consider additional factors such as the investment horizon, diversification, and the investor’s risk tolerance. These factors can help you make more informed investment decisions and better manage your portfolio.
12.6 Key Takeaways
Understanding risk and return, as well as key performance metrics like beta, alpha, and the Sharpe ratio, is crucial for evaluating investment opportunities. By considering these factors, along with your investment horizon, diversification, and risk tolerance, you can make more informed decisions and achieve your financial goals.
In conclusion, we hope you found these chapters both informative and engaging. By understanding and applying the concepts covered, you will be better equipped to navigate the world of finance and make sound decisions that lead to financial success. Remember that learning is an ongoing journey, and we encourage you to continue expanding your knowledge and exploring new topics. Happy investing!
Punti chiave:
Dichiarazione di chiusura: Delving into financial metrics like Beta, Alpha, and the Sharpe Ratio unveils a new dimension of understanding the risk-return dynamics. This section empowers you to evaluate your investments meticulously, ensuring alignment with your financial goals and risk tolerance.
- Metric Significance: Beta gauges stock volatility against the market, while alpha reveals performance relative to benchmarks, and the Sharpe ratio considers risk-adjusted returns.
- Practical Examples: Know how to apply these metrics in real scenarios, such as assessing if a stock’s volatility aligns with market movements or evaluating its performance against benchmarks.
- Holistic Consideration: Beyond metrics, elements like risk tolerance, diversification, and investment horizon play a decisive role in shaping portfolio outcomes.
