
Global: Metrics of Risk and Return
レッスンの学習目標:
- Understand the Risk-Return Trade-Off: Learn how アルファ, ベータ、そして シャープレシオ work together to measure investment performance, risk, and reward. You’ll gain the ability to evaluate whether an investment aligns with your financial goals and risk level.
- Explore Beta and Market Sensitivity: Gain insight into how ベータ shows a stock’s volatility relative to the market. You will learn to interpret different Beta levels and understand which types of stocks offer stability または high growth potential.
- Learn the Value of Alpha: Discover how アルファ helps you measure an investment’s excess return over the market. You’ll be able to identify whether an asset or portfolio is truly adding value beyond what is expected based on risk.
- Use Sharpe Ratio to Compare Risk and Reward: Learn how the シャープレシオ reveals which investments provide the best risk-adjusted returns. This will help you decide which asset combinations offer the most efficient return for the amount of risk taken.
- Apply Other Key Factors: Understand how 多様化, market conditions, time horizon、 そして liquidity influence your portfolio’s risk and return. This broader perspective equips you to build a more balanced and thoughtful investment strategy.
A. Introduction
Investors face a constant trade-off between 危険 そして 戻る. Understanding key metrics like ベータ, アルファ、そして シャープレシオ helps assess the performance of investments in relation to the risk taken. These metrics provide insights into an investment’s volatility, ability to generate returns above the market, and overall risk-adjusted performance. In this chapter, we will explore how these tools work globally and their importance in evaluating the risk-return relationship in various investments.
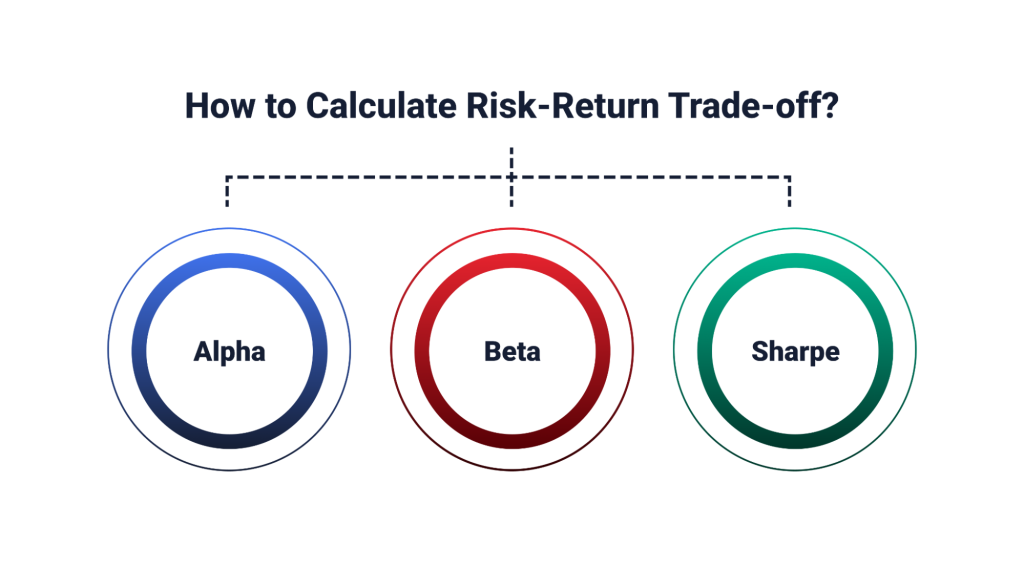
形: How to Calculate Risk-Return Trade-off
説明:
This figure illustrates three key metrics—アルファ, ベータ、そして シャープレシオ—that are used to calculate the risk-return trade-off in investing. Alpha measures the performance of an investment relative to a benchmark, indicating whether it has performed better or worse than expected. Beta assesses the volatility of an investment compared to the market, showing how sensitive it is to market movements. The Sharpe Ratio evaluates the risk-adjusted return of an investment, measuring how much excess return is earned for each unit of risk taken. These metrics help investors understand the balance between potential returns and associated risks.
重要なポイント:
- アルファ represents the excess return of an investment compared to a market benchmark, helping to evaluate whether it has added value.
- ベータ measures the investment’s volatility relative to the broader market, indicating its risk level and sensitivity to market changes.
- の シャープレシオ assesses the risk-adjusted return, providing a way to compare investments based on their return per unit of risk.
- Together, these metrics provide a comprehensive understanding of the risk-return dynamics of an investment.
情報の応用:
Investors can use アルファ, ベータ、そして シャープレシオ to make informed decisions by evaluating whether an investment is worth the 危険 その return potential. These metrics are essential for assessing portfolio performance and aligning investments with an investor’s リスク許容度 そして 財務目標. Understanding these metrics helps investors balance risk and return effectively in their investment strategy.
B. Beta
ベータ measures a stock’s volatility relative to the overall market. It indicates how sensitive a stock is to broader market movements.
- Beta > 1: A Beta greater than 1 means the stock is more volatile than the market. For example, a Beta of 1.5 indicates that the stock tends to be 50% more volatile than the market. This is common in high-growth sectors like technology.
- Beta < 1: A Beta less than 1 means the stock is less volatile than the market. A Beta of 0.7, for example, indicates that the stock experiences 30% less volatility than the market. Low-Beta stocks are typically found in defensive sectors like utilities または consumer staples.
- Beta = 1: A Beta of 1 indicates that the stock moves in line with the market. The S&P 500 index has a Beta of 1, serving as the benchmark for many Beta calculations.
Beta helps investors understand how their investments are likely to perform during market ups and downs. High-Beta stocks may offer greater returns during market rallies but come with higher risk during downturns, while low-Beta stocks provide more stability.
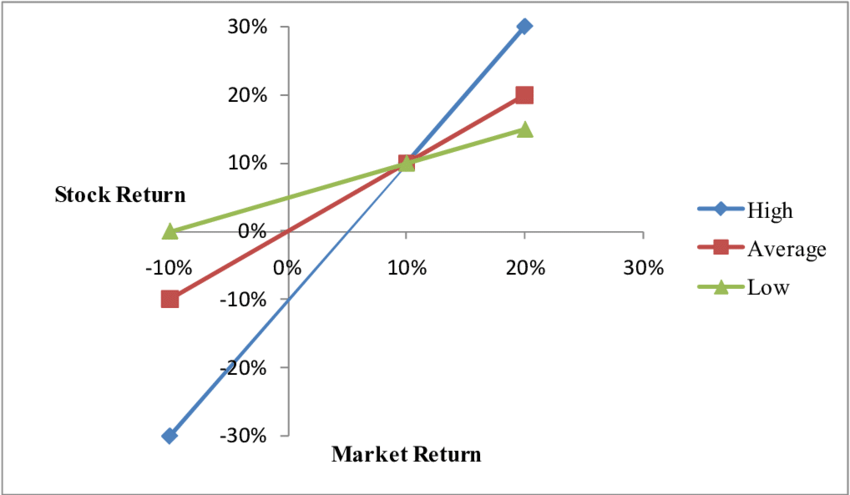
形: Stock Return vs. Market Return: High, Average, and Low Volatility Stocks
説明:
This chart shows the relationship between stock returns そして market returns for stocks with different levels of volatility: high, average、 そして low. The blue line represents high-volatility stocks, which exhibit the largest fluctuations in returns relative to changes in the market. The red line indicates average-volatility stocks, displaying moderate changes in returns. The green line represents low-volatility stocks, with returns that change the least in response to market shifts. The slopes of the lines indicate the sensitivity (Beta) of each stock’s returns to the market movements.
重要なポイント:
- High-volatility stocks (blue line) show greater sensitivity to market changes, implying a higher Beta and risk.
- Average-volatility stocks (red line) exhibit moderate responsiveness to market fluctuations, indicating a balanced risk-return profile.
- Low-volatility stocks (green line) are less sensitive to market movements, suggesting lower risk and a more stable return.
- Understanding the relationship between stock and market returns is essential for assessing investment risk.
情報の応用:
Investors can use this data to make informed decisions about ポートフォリオの多様化. By knowing how different stocks react to market changes, investors can align their portfolios with their リスク許容度 そして investment goals. For those seeking high returns with more risk, high-volatility stocks may be suitable. Conversely, for stability and lower risk, low-volatility stocks are more appropriate. This analysis is useful in managing risk and optimizing portfolio performance.
C. Alpha
アルファ measures an investment’s excess return compared to the market, accounting for the risk taken (as measured by Beta). It represents how well or poorly a stock has performed relative to its benchmark.
- ポジティブアルファ: A positive Alpha indicates that the investment outperformed the market after adjusting for volatility. For example, an Alpha of 2% means the investment generated 2% more return than expected based on its Beta.
- ネガティブアルファ: A negative Alpha indicates underperformance relative to the market. If a stock has an Alpha of -1%, it performed 1% worse than expected after considering the level of risk involved.
Alpha is particularly useful for assessing the effectiveness of active management strategies. For actively managed portfolios or mutual funds, a positive Alpha suggests the portfolio manager has added value beyond the market’s return, while a negative Alpha may indicate poor management decisions.
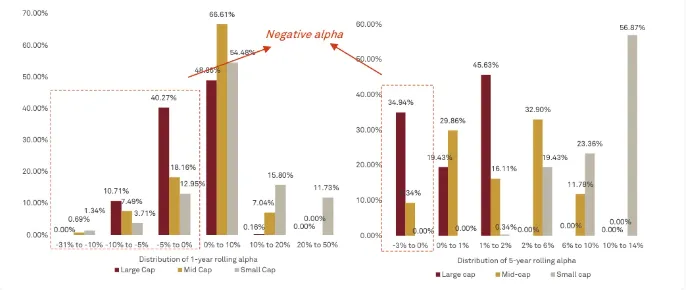
形: Distribution of 1-Year and 5-Year Rolling Alpha for Large Cap, Mid Cap, and Small Cap Stocks
説明:
This bar chart presents the distribution of 1-year そして 5-year rolling alpha for large-cap, mid-cap, and small-cap stocks. アルファ measures the excess return of an investment relative to a benchmark index. The left side of the chart displays the distribution of 1-year rolling alpha, while the right side shows the distribution of 5-year rolling alpha. The bars are segmented by large-cap (red), mid-cap (yellow), and small-cap (gray) stocks. The chart highlights the presence of negative alpha in both 1-year and 5-year rolling returns, indicating underperformance against the benchmark. Mid-cap stocks exhibit a higher concentration of alpha around 0% to 10% for the 1-year measure, while large-cap stocks show higher distribution in the negative alpha range for both 1-year and 5-year metrics.
重要なポイント:
- アルファ を表す excess return of an investment compared to the market index.
- Mid-cap stocks demonstrate higher positive alpha in the 0% to 10% range over a 1-year period.
- Large-cap stocks have more pronounced negative alpha, indicating greater underperformance relative to benchmarks.
- Small-cap stocks exhibit wider dispersion of alpha, suggesting variability in returns.
情報の応用:
Investors can use this analysis to evaluate the performance of different asset classes relative to benchmarks. Positive alpha suggests better-than-market returns, while negative alpha indicates underperformance. By understanding alpha distributions over different time horizons, investors can make informed decisions about ポートフォリオ配分, considering their リスク許容度 そして return expectations. This data aids in identifying potentially overperforming または underperforming sectors within large-cap, mid-cap, and small-cap stocks, improving investment strategy formulation.
D. Sharpe Ratio
の シャープレシオ evaluates the risk-adjusted return of an investment. It compares the excess return (above the risk-free rate, such as government bonds) to the investment’s volatility, giving a clearer picture of the trade-off between risk and reward.
- High Sharpe Ratio: A higher Sharpe Ratio indicates better risk-adjusted performance. For example, a Sharpe Ratio of 1.5 means that the investment provided 1.5 units of return for every unit of risk taken. This ratio is considered very good and indicates that the investment generated a strong return relative to its volatility.
- Low Sharpe Ratio: A low Sharpe Ratio suggests that the return does not justify the risk. A Sharpe Ratio below 1.0 indicates that the investment may not be offering enough reward for the level of risk involved.
The Sharpe Ratio is widely used to compare different assets or portfolios. It helps investors identify which investments provide the best return for a given level of risk, making it a valuable tool in portfolio management.
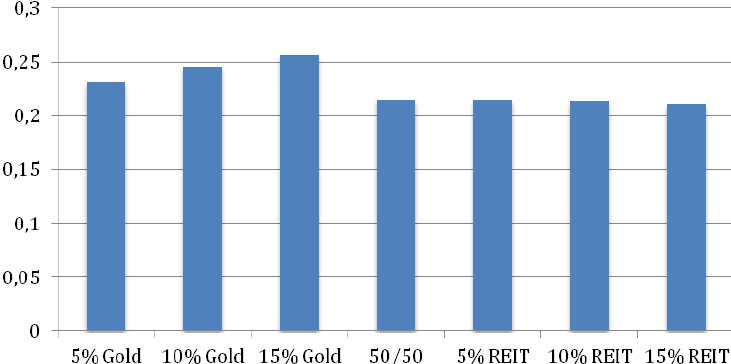
形: Sharpe Ratios for Various Asset Allocations
説明:
This bar chart shows the Sharpe ratios for different portfolio allocations between gold そして 不動産投資信託(REIT). The bars represent seven distinct allocations: 5% gold, 10% gold, 15% gold, 50/50 (equal split between gold and REITs), 5% REIT, 10% REIT、 そして 15% REIT. The Sharpe ratio measures the risk-adjusted return, indicating how much return is generated per unit of risk. The higher the Sharpe ratio, the better the portfolio’s performance on a risk-adjusted basis. In this figure, the highest Sharpe ratio is observed for 15% gold, suggesting it has the best risk-adjusted return among the allocations.
重要なポイント:
- シャープレシオ is a measure of risk-adjusted returns, helping investors assess portfolio performance relative to risk.
- Gold allocations (5%, 10%, and 15%) show higher Sharpe ratios than REIT allocations, suggesting better risk-adjusted returns.
- The highest Sharpe ratio is achieved with a 15% gold allocation, indicating it offers the best return relative to its risk.
- あ 50/50 split between gold and REITs shows a mid-range Sharpe ratio, balancing risk and return.
情報の応用:
Investors can use this data to evaluate the risk-return trade-off of incorporating gold または REIT(不動産投資信託) into their portfolios. Allocating a portion of the portfolio to gold, especially around 15%, can enhance risk-adjusted returns. The Sharpe ratio helps investors understand the benefits of diversification by assessing how different asset allocations impact overall portfolio performance. This insight aids in portfolio optimization, helping investors adjust allocations based on their リスク許容度 そして return objectives.
E. 考慮すべきその他の要素
While ベータ, アルファ、そして シャープレシオ are essential metrics for evaluating risk and return, there are other factors investors should consider:
- 市況: Economic cycles, interest rates, and inflation all affect the risk and return of investments. For instance, during periods of high inflation, fixed-income assets may underperform due to reduced purchasing power.
- タイムホライズン: The length of time an investor plans to hold an investment affects their risk tolerance. Long-term investors may be able to withstand more volatility in exchange for higher returns, while short-term investors may prefer low-Beta, stable assets.
- 多様化: A diversified portfolio can reduce overall risk by spreading investments across different sectors, asset classes, and geographic regions. Beta and Sharpe Ratios for diversified portfolios often reflect lower volatility compared to individual high-risk assets.
- 流動性: Investments in illiquid assets, such as real estate or small-cap stocks, may carry higher risk due to the difficulty of selling the asset quickly without affecting the price.
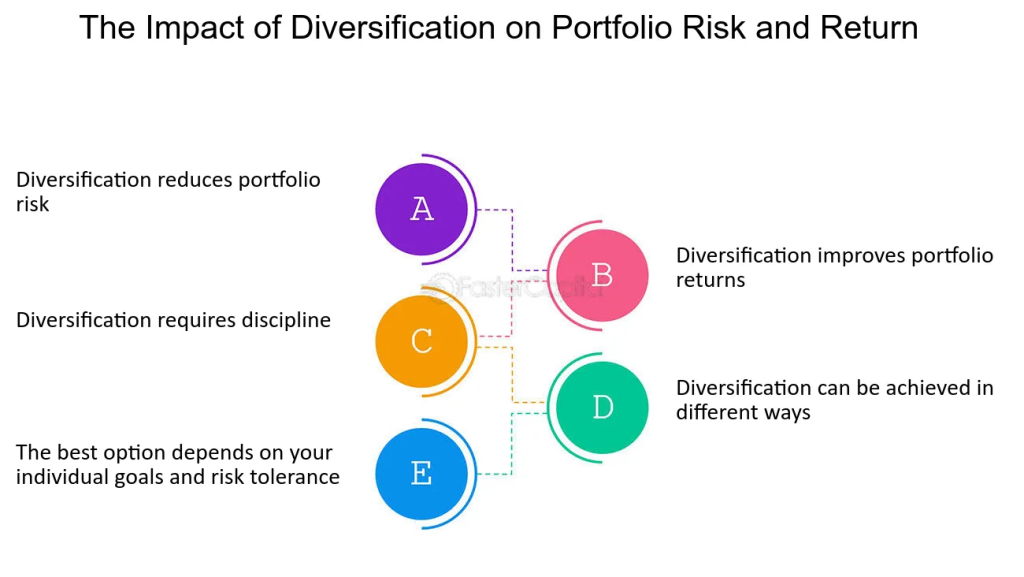
形: The Impact of Diversification on Portfolio Risk and Return
説明:
This figure highlights five key aspects of 多様化 in investment portfolios. Diversification aims to reduce portfolio risk while potentially improving returns. It requires a disciplined approach and can be achieved through various strategies, depending on an individual’s リスク許容度 そして investment goals. The components, labeled あ に E, each represent different aspects: あ indicates reduced risk, B reflects improved returns, C emphasizes the need for discipline, D notes the flexibility of diversification strategies, and E stresses the importance of aligning diversification with personal goals.
重要なポイント:
- iversification is a strategy to reduce portfolio risk by spreading investments across various assets.
- It can also enhance portfolio returns by reducing the impact of underperforming assets.
- Achieving effective diversification requires discipline and careful selection of assets.
- It can be approached through different methods, such as investing across asset classes, 産業, 、 または geographies.
- The best diversification strategy depends on individual investment goals そして リスク許容度.
情報の応用:
Investors can use diversification to balance risk and return in their portfolios. By allocating funds across different asset types, investors can reduce exposure to any single asset’s poor performance. This approach is particularly useful for managing volatility そして達成する steadier returns over time. Understanding the impact of diversification helps investors make 情報に基づいた意思決定, aligning their portfolios with their 財務目標 そして risk preferences.
F. Key Takeaways
- ベータ measures an investment’s volatility relative to the market, helping investors assess how sensitive their investments are to market movements.
- アルファ indicates an investment’s performance compared to the market after accounting for risk, revealing the effectiveness of active management.
- シャープレシオ assesses risk-adjusted returns, showing whether an investment offers adequate reward for the level of risk involved.
- Other factors, such as market conditions, time horizon, 多様化、 そして liquidity, must also be considered when evaluating the risk-return relationship.
These metrics, when used together, give investors a clearer picture of their portfolios’ risk profile and help in making informed decisions about which assets to hold based on their risk tolerance and investment goals.
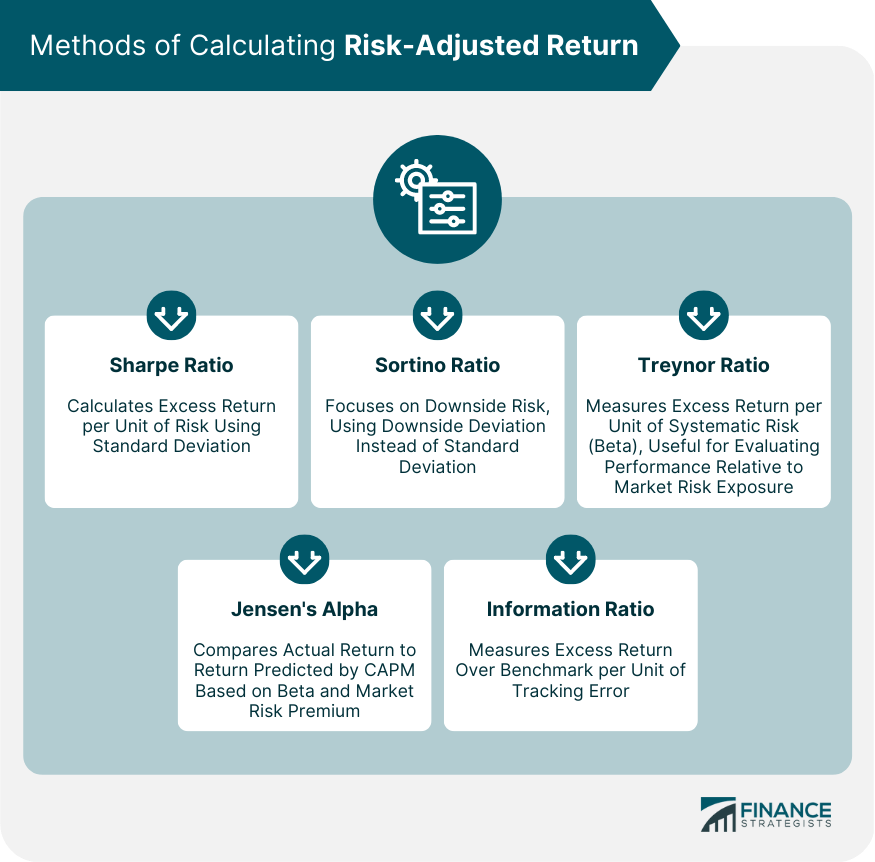
形: Methods of Calculating Risk-Adjusted Return
説明:
This figure presents various methods used to calculate risk-adjusted returns, helping investors understand the balance between risk and return. The figure includes five main methods: シャープレシオ, Sortino Ratio, Treynor Ratio, Jensen’s Alpha、 そして Information Ratio. The シャープレシオ measures excess return relative to total risk using standard deviation. The Sortino Ratio emphasizes downside risk, replacing standard deviation with downside deviation. The Treynor Ratio assesses excess return per unit of systematic risk (beta), making it suitable for comparing returns against market exposure. Jensen’s Alpha compares actual returns to expected returns based on the Capital Asset Pricing Model (CAPM). The Information Ratio measures excess return over a benchmark, considering tracking error.
重要なポイント:
- Risk-adjusted return measures performance by considering the level of risk taken to achieve returns.
- シャープレシオ provides a simple measure of return per unit of total risk.
- Sortino Ratio refines the Sharpe Ratio by focusing on negative volatility (downside risk).
- Treynor Ratio is ideal for assessing returns in relation to systematic (market) risk.
- Jensen’s Alpha measures the ability to achieve returns above those predicted by the market model.
- Information Ratio evaluates active management by comparing performance to a benchmark with tracking error considered.
情報の応用:
These methods are crucial for 投資家 who wish to assess the efficiency of an investment strategy in terms of risk and return. By analyzing these ratios, investors can identify which strategies provide higher returns relative to the risks involved, aiding in better ポートフォリオ管理 そして decision-making. Understanding these ratios enables investors to select strategies that align with their リスク許容度 そして investment objectives.
主なレッスン情報:
- Beta shows investment volatility, helping investors understand how sensitive a stock is to market changes. Stocks with Beta > 1 are more volatile, while those with Beta < 1 are more stable, often found in defensive sectors.
- Alpha measures excess returns, showing whether an investment has outperformed the market after accounting for risk. A positive Alpha indicates added value, while a negative Alpha signals underperformance.
- Different asset classes perform differently: Charts show that mid-cap stocks may generate better Alpha over time, while gold allocations (e.g., 15%) produce the best Sharpe Ratios, demonstrating their value in a diversified portfolio.
- Other factors matter too: 市況, like inflation and interest rates, influence returns. Your investment time horizon affects your ability to handle risk, and liquidity can increase or reduce risk depending on how easily assets can be sold.
- Diversification helps manage risk: By spreading investments across sectors and asset types, you can reduce overall volatility while maintaining return potential. This improves long-term portfolio stability and aligns better with individual goals.
閉会の辞:
Using Alpha, Beta, and the Sharpe Ratio—along with other key investment factors—empowers you to assess and manage your investment portfolio more effectively. These tools help you balance risk with reward, choose the right assets, and make informed decisions that match your long-term goals.
