形: A dynamic representation of the stock market with fluctuating graphs, numbers, and symbols. The image encapsulates the volatile nature of stock trading and the intricacies of market analysis.
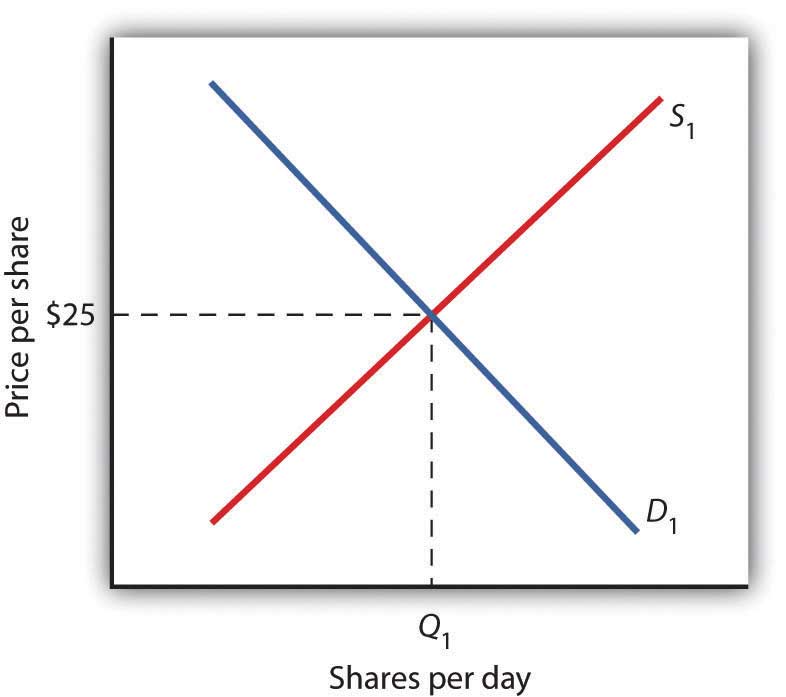
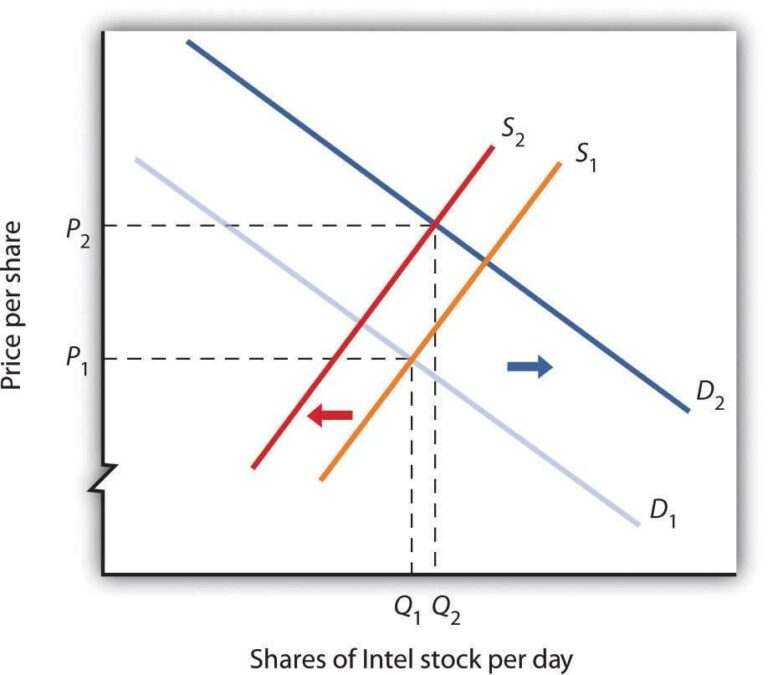
応用: Supply and demand charts, like the one mentioned, are fundamental in understanding market dynamics. Any event or information that can cause shifts in these curves can lead to price fluctuations. Being able to predict or understand such shifts gives investors, policymakers, and businesses insights into price movements and helps in decision-making.


