
글로벌: 경기 순환에 영향을 미치는 글로벌 거시경제 요인 소개
수업 학습 목표:
- 소개: Gain a foundational understanding of global macroeconomic factors that influence the business cycle and how they impact stock markets worldwide. This knowledge is essential for investors, policymakers, and business leaders to make informed decisions.
- Understand the role of 이자율 set by central banks like the Federal Reserve and the European Central Bank, and how they influence economic activity by affecting borrowing costs for businesses and consumers.
- Explore how 인플레이션 affects economic stability and purchasing power, and the measures central banks take to control it, such as adjusting interest rates.
- Learn about the impact of government fiscal policies on economic activity, including how governments use spending and taxation to stimulate or cool down the economy.
- Analyze the effects of global trade and supply chains on the business cycle, considering how disruptions and international trade policies can impact economic growth and stock markets.
A. Introduction to Global Macroeconomic Factors Affecting the Business Cycle
Macroeconomic factors are broad, external forces that influence the performance of entire economies and, by extension, stock markets around the world. These factors play a key role in shaping the 사업주기, which refers to the natural rise and fall of economic growth over time.
Some of the most important global macroeconomic factors include:
- 이자율: Central banks in different countries, such as the Federal Reserve in the United States or the European Central Bank (ECB) in Europe, set interest rates that affect borrowing costs for businesses and consumers. When interest rates are low, borrowing becomes cheaper, encouraging spending and investment, which stimulates economic growth. Conversely, high interest rates can slow down an economy by making borrowing more expensive.

2. Inflation: Inflation refers to the rate at which the general level of prices for goods and services rises. Moderate inflation is typically seen as a sign of a growing economy, while high inflation can erode purchasing power and decrease consumer spending. Central banks often adjust interest rates to control inflation, making it a critical factor in the global business cycle.
3. Government Fiscal Policy: Governments can influence the business cycle through 재정 정책, which includes taxation and government spending. During economic slowdowns, governments may increase spending or cut taxes to stimulate the economy (expansionary fiscal policy), while during periods of rapid growth, they may reduce spending or raise taxes to cool down the economy (contractionary fiscal policy).
4. Global Trade and Supply Chains: International trade agreements, tariffs, and global supply chain disruptions can all impact the business cycle. For example, disruptions in supply chains due to geopolitical tensions or natural disasters can slow down production and economic growth, while trade agreements that remove tariffs can boost cross-border commerce.
5. Monetary Policy: Apart from interest rate decisions, central banks may use other monetary policies, such as quantitative easing (QE), where they inject money into the economy by purchasing financial assets. This helps to lower interest rates further and boost liquidity in the market, often encouraging investment in stocks.
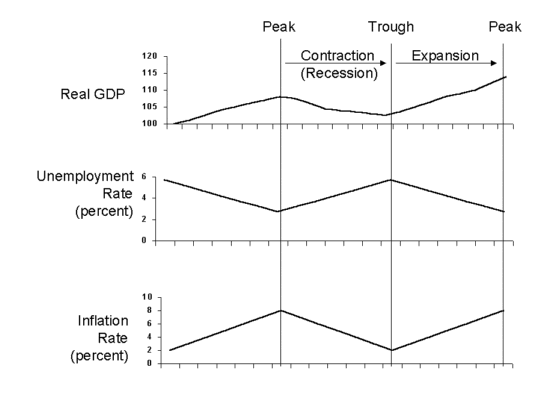
수치: Business Cycle Phases (Real GDP, Unemployment, and Inflation)
설명:
This figure illustrates the 경기 순환 단계 through three graphs: Real GDP, 실업률, 그리고 인플레이션율. The top graph shows Real GDP increasing during an expansion, peaking, then declining during a contraction (recession), reaching a 구유, and finally rising again. The second graph represents the 실업률, which moves inversely to Real GDP: rising during contractions and falling during expansions. The third graph displays inflation rate trends, which typically rise during expansions and decrease during contractions.
주요 시사점:
- Real GDP increases during economic expansions and decreases during contractions, reflecting overall economic health.
- Unemployment rates rise during contractions and fall during expansions, indicating changes in labor market conditions.
- Inflation rates generally increase during expansions as demand rises and decrease during contractions due to reduced demand.
- The business cycle progresses through peak, 구유, contraction, 그리고 expansion phases.
정보의 응용:
이해하기 사업주기 is essential for investors to anticipate 시장 경향 and adjust their strategies accordingly. By analyzing Real GDP, unemployment, and inflation, investors can gauge the economic environment and make informed decisions about asset allocation, 위기 관리, 그리고 investment timing. Recognizing these cycles helps in identifying potential entry and exit points in markets.
B. Common Macroeconomic Terms Used in International Markets
Macroeconomic terms are essential for understanding how economies and stock markets function globally. Here are some of the most commonly used terms:
- Gross Domestic Product (GDP): GDP represents the total value of all goods and services produced within a country. It is a key indicator of a country’s economic health. When GDP is growing, it generally signals that the economy is expanding, which can lead to higher stock prices. Conversely, a shrinking GDP indicates economic contraction, which can negatively impact stock markets.
- 실업률: The unemployment rate measures the percentage of the labor force that is unemployed but actively seeking work. A low unemployment rate is typically a sign of a strong economy, while a high unemployment rate can signal economic difficulties, which may lead to reduced consumer spending and lower corporate profits.
- 인플레이션: Inflation measures the rate at which prices for goods and services increase over time. While moderate inflation is a sign of economic growth, high inflation can reduce consumers’ purchasing power and lower demand for goods, which may negatively affect stock prices.
- 이자율: As mentioned earlier, interest rates are set by central banks and influence the cost of borrowing. High interest rates can slow economic growth by making loans more expensive, while low interest rates can stimulate growth by encouraging borrowing and investment.
- 무역수지: The trade balance is the difference between a country’s exports and imports. A trade surplus occurs when a country exports more than it imports, which can be a positive sign for the economy. A trade deficit, where imports exceed exports, can indicate that a country is spending more on foreign goods than it is earning from its own exports, which may impact the currency and stock markets.
- 통화 정책: This refers to the actions taken by central banks to manage the supply of money in the economy, primarily through interest rates and asset purchases. Central banks use monetary policy to control inflation and influence economic growth.
- 재정 정책: Fiscal policy involves government spending and taxation. Expansionary fiscal policy (increased government spending or tax cuts) can stimulate economic growth, while contractionary fiscal policy (reduced spending or tax increases) can slow down an overheating economy.
- Consumer Confidence: This is a measure of how optimistic or pessimistic consumers feel about the state of the economy. High consumer confidence typically leads to increased spending, which boosts economic growth, while low consumer confidence can result in decreased spending and a slowdown in economic activity.
- Exchange Rates: Exchange rates refer to the value of one currency in relation to another. Exchange rate fluctuations can have a significant impact on international trade and investment. A weaker currency makes exports cheaper for foreign buyers, while a stronger currency can reduce export competitiveness.
- Public Debt: Public debt is the total amount of money that a government owes to creditors. High levels of public debt can lead to increased borrowing costs for the government and can affect investor confidence, particularly if the debt becomes unsustainable.
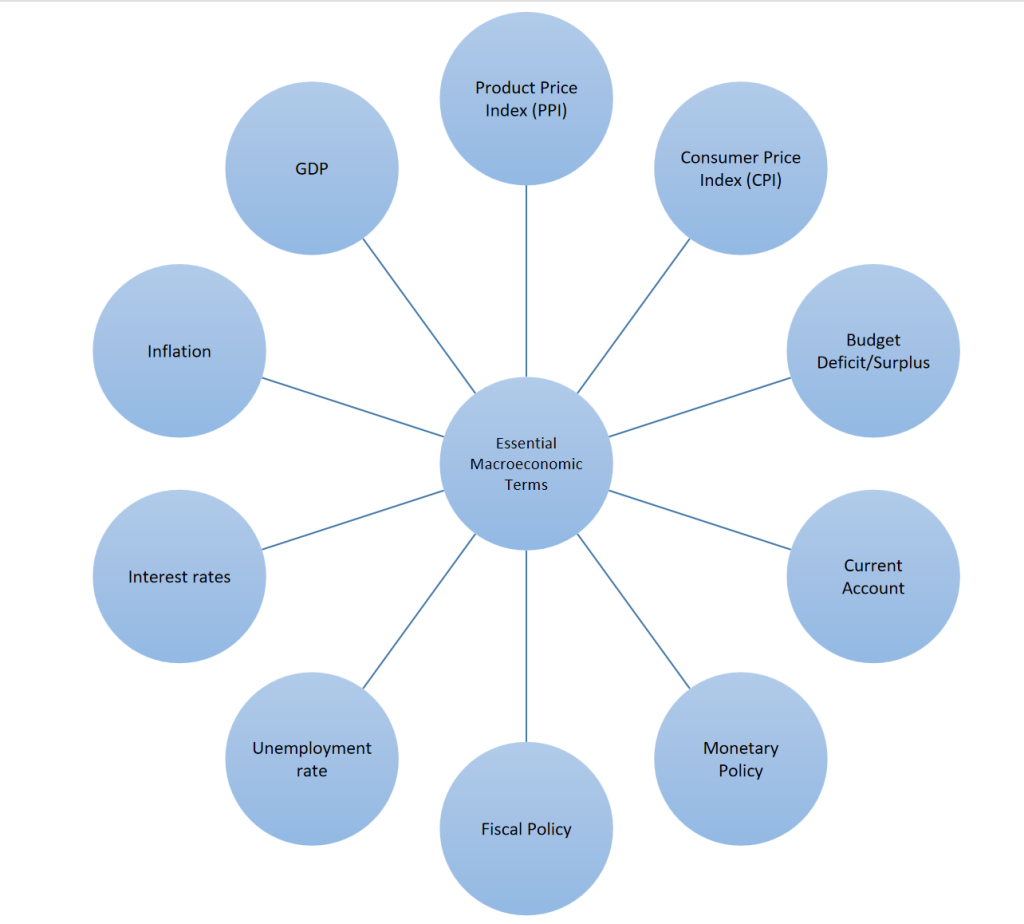
수치: 주요 거시경제 지표 비교
설명:
이 그림은 경제 정책과 시장 성과를 이해하는 데 필수적인 10가지 필수 거시경제 용어를 제시합니다. 여기에는 국내 생산자가 생산물에 대해 받는 판매 가격의 시간 경과에 따른 평균 변화를 추적하는 제품 가격 지수(PPI)와 가중 평균 시장의 가격 수준 변화를 측정하는 소비자 물가 지수(CPI)가 포함됩니다. 가계가 구매한 소비재 및 서비스 바구니입니다. 예산 적자/흑자는 정부의 재정 건전성을 나타내며, 적자는 지출이 수입을 초과한다는 의미입니다. 경상수지는 국가의 무역수지, 국경간 투자에 대한 순이익, 직접지불 등을 반영합니다. 통화정책과 재정정책은 각각 이자율과 세금을 통해 경제에 영향을 미치는 중앙은행과 정부의 조치를 나타냅니다. 실업률은 노동력 대비 적극적으로 일자리를 찾는 사람의 수를 백분율로 측정한 것입니다. 중앙은행이 통제하는 이자율은 차입 비용과 경제 활동에 영향을 미칩니다. 인플레이션은 상품과 서비스의 전반적인 가격 수준이 상승하는 비율을 나타냅니다. 마지막으로, 국내총생산(GDP)은 국가의 총 경제 활동에 대한 가장 광범위한 정량적 척도입니다.
주요 시사점:
- Product Price Index (PPI) and Consumer Price Index (CPI) are indicators of price changes in the economy, affecting consumer purchasing power and business 이익.
- Budget deficit/surplus and current account reflect a nation’s economic standing and its 국제 금융 강도.
- Monetary policy and fiscal policy are tools used by governments to steer economic growth and stabilize the economy.
- The unemployment rate is a key indicator of labor market health, while interest rates influence investment and consumption.
- Inflation rates are crucial for maintaining a balance between economic growth and cost of living.
- GDP is a primary indicator of a country’s economic performance and growth potential.
정보의 응용:
Understanding these macroeconomic terms is crucial for investors and students of finance as they provide a snapshot of economic health and market conditions. Investors can use this data to make informed decisions about where to allocate their resources, anticipating market movements and potential returns. For example, a rising CPI may signal impending interest rate hikes, which could affect stock and bond markets. A country with a consistent budget surplus and a strong current account might be seen as a safer investment. Recognizing the interplay between monetary policy, fiscal policy, and GDP growth can guide investment timing and strategy. These indicators are also vital for understanding government policy impacts on the economy and personal finances, making them essential knowledge for anyone looking to invest or work in finance.
C. General Comparison of Two Countries Using Macroeconomic Terms
On a global scale, comparing two countries like the United States 그리고 Japan illustrates how macroeconomic terms play out in different regions.
- GDP: The U.S. has one of the largest economies in the world, with GDP driven by consumer spending and technological innovation. Japan, while still a major economy, has a slower GDP growth rate due to an aging population and stagnant domestic consumption.
- 인플레이션: The U.S. typically experiences moderate inflation, while Japan has struggled with deflation, where prices fall over time, leading to reduced consumer spending and economic stagnation.
- 이자율: The Federal Reserve in the U.S. uses interest rates to control inflation and stimulate growth. Japan’s Bank of Japan has maintained near-zero or negative interest rates for years in an attempt to combat deflation and encourage investment.
- Public Debt: Japan has one of the highest public debt levels in the world, but its domestic investor base allows it to manage this debt more easily. The U.S. also has high public debt, but it is viewed as less risky due to the global role of the U.S. dollar.
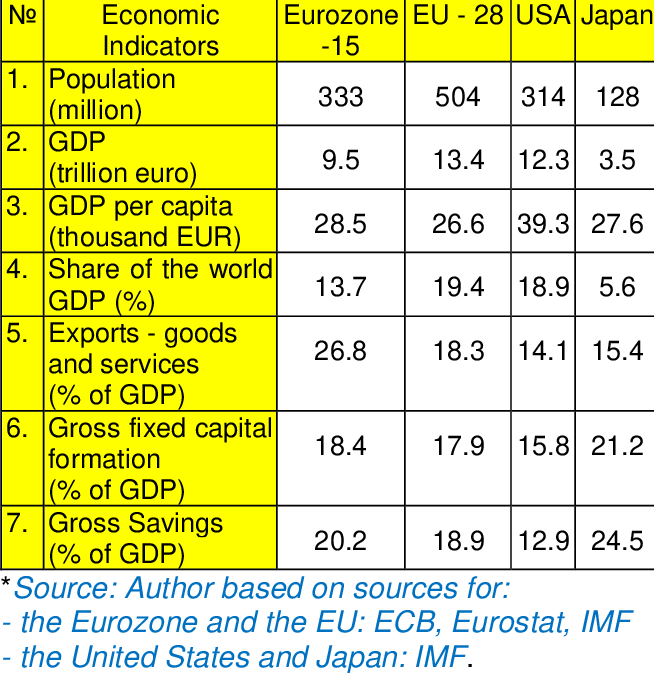
수치: Comparison of Key Economic Indicators of the Eurozone, EU-28, USA, and Japan
설명:
This table compares several economic indicators across four regions: the Eurozone-15, EU-28, 미국, 그리고 Japan. The indicators include population, GDP, GDP per capita, share of world GDP, exports as a percentage of GDP, gross fixed capital formation, 그리고 gross savings. Each column lists values for these metrics, illustrating differences in economic size, output, savings, and capital investment between these regions.
주요 시사점:
- Population is highest in the EU-28 (504 million) and lowest in Japan (128 million).
- 그만큼 미국 has the highest GDP per capita (39.3 thousand EUR), while Japan follows closely with 27.6 thousand EUR.
- Exports contribute most significantly to the Eurozone-15’s GDP (26.8%).
- Gross savings as a percentage of GDP is highest in Japan (24.5%), indicating stronger savings habits.
정보의 응용:
These comparative indicators provide insights into the economic strength, export orientation, and savings behavior of different regions. This data can help investors assess regional economic performance, guide 투자 결정, and understand broader economic trends that influence global markets. Analyzing these indicators is essential for evaluating potential investment risks and opportunities.
D. Industry-Wide Effects of Macroeconomic Terms
Across the globe, macroeconomic terms affect industries in diverse ways:
- 기술: In countries like the U.S., 이자율 그리고 tax policies play crucial roles in determining how much companies in the tech sector invest in research and development.
- 에너지: The global energy industry is heavily influenced by 인플레이션 그리고 exchange rates. Oil prices, for example, are often pegged to the U.S. dollar, so fluctuations in exchange rates can lead to price volatility.
- 보건 의료: The healthcare sector, particularly in countries with government-funded healthcare systems, is affected by 재정 정책. Governments may increase or cut healthcare budgets depending on the economic cycle, influencing stock prices in healthcare companies.
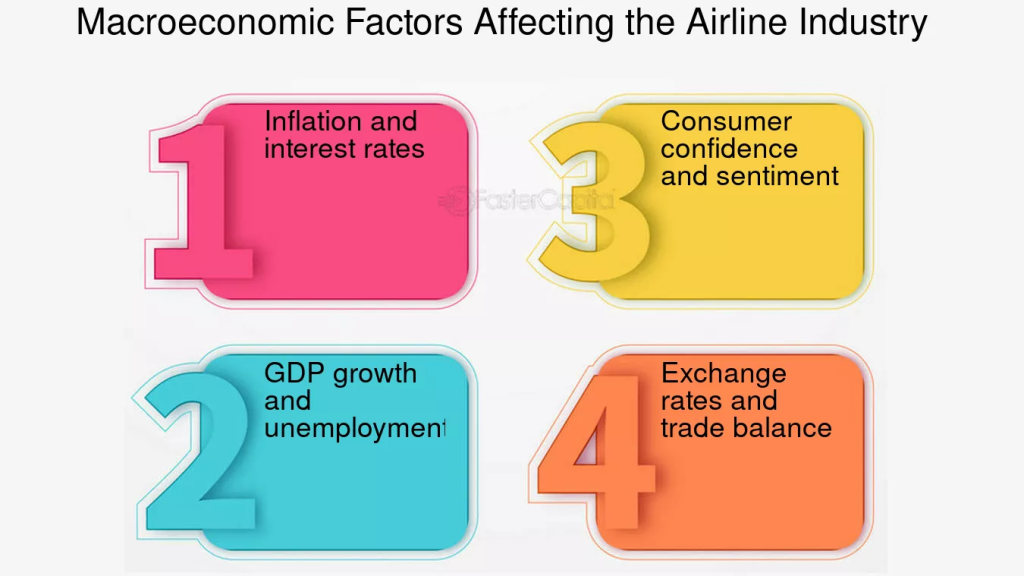
수치: Macroeconomic Factors Affecting the Airline Industry
설명:
The image illustrates four macroeconomic factors that impact the airline industry: (1) Inflation and interest rates, (2) GDP growth and unemployment, (3) Consumer confidence and sentiment, and (4) Exchange rates and trade balance. Each factor plays a significant role in determining 수요, 소송 비용, 그리고 overall profitability within the airline sector.
주요 시사점:
- Inflation and interest rates affect operational costs 그리고 ticket prices.
- GDP growth and unemployment influence passenger demand and travel frequency.
- Consumer confidence drives travel behavior, with higher confidence leading to more leisure and business travel.
- Exchange rates impact international travel costs and airline revenue from overseas markets.
정보의 응용:
Understanding these macroeconomic factors can help investors evaluate the financial health 그리고 future performance of airlines. By analyzing these indicators, investors can make informed decisions regarding 투자 in the airline sector or other industries affected by similar factors.
E. Global: Top 10 Economic Indicators
- Global GDP: Measures the world’s total economic output.
- Global Inflation Rates: Tracks price increases globally.
- 이자율: Set by major central banks like the Federal Reserve and ECB.
- Trade Balances: Key for export-driven economies.
- Global Unemployment Rates: Shows labor market strength worldwide.
- 산업 생산품: Reflects the health of the manufacturing sector globally.
- Consumer Confidence: Measures optimism in global markets.
- Stock Market Indices: Such as the S&P 500 그리고 FTSE 100, reflecting investor confidence.
- Commodity Prices: Includes oil, gold, and other key global commodities.
- Foreign Exchange Rates: Track the value of major currencies like the U.S. dollar and euro.
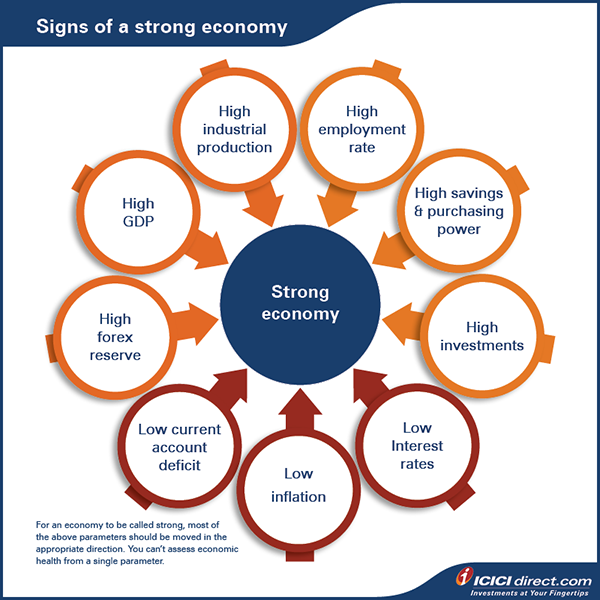
수치: Signs of a Strong Economy
설명:
The image outlines the key indicators of a strong economy. It includes factors such as high industrial production, high GDP, high employment rate, high forex reserve, high savings and purchasing power, high investments, low current account deficit, low interest rates, 그리고 low inflation. Each indicator contributes to the overall economic strength and signals growth and stability within a country’s economy.
주요 시사점:
- High GDP, industrial production, 그리고 employment rate are crucial indicators of economic strength.
- High forex reserves reflect a country’s capacity to manage currency fluctuations and global trade.
- Low inflation 그리고 low interest rates promote consumer spending and investment.
- High savings and purchasing power encourage consumer confidence and economic growth.
정보의 응용:
These indicators can help investors assess the economic environment before making investment decisions. By understanding these indicators, users can better evaluate the potential risks 그리고 opportunities in various sectors or economies, making informed investment choices.
F. Overview of Monetary and Fiscal Policy Worldwide
통화 정책: Central banks worldwide, such as the Federal Reserve, ECB, 그리고 Bank of Japan, control the money supply through interest rates and quantitative easing. These policies influence inflation, employment, and overall economic growth.
재정 정책: Governments worldwide use fiscal policies to influence their economies by adjusting taxes and public spending. Expansionary fiscal policies (e.g., tax cuts) are used during recessions, while contractionary policies (e.g., tax increases) help slow down inflation in times of rapid growth.
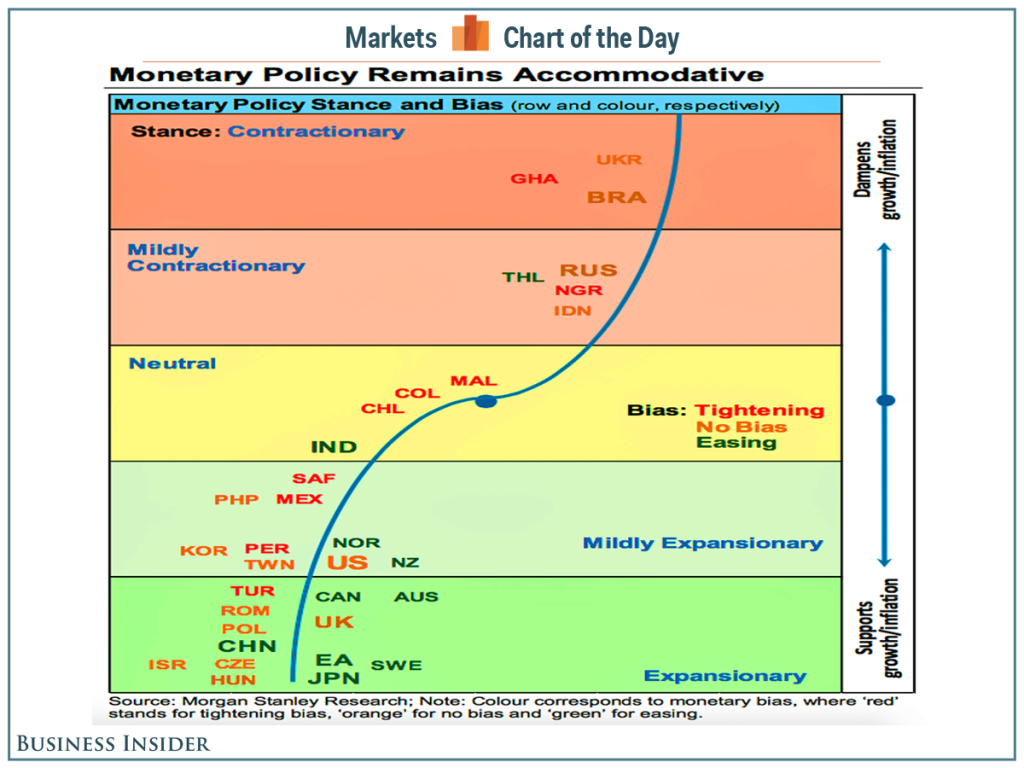
수치: Monetary Policy Remains Accommodative
설명:
The chart categorizes global monetary policy stances into contractive, neutral, 그리고 expansionary zones. It shows the bias of each country, indicating whether their policy aims to tighten, maintain, 또는 ease monetary conditions. The vertical axis suggests whether policies are intended to dampen growth/inflation 또는 support growth/inflation. Countries positioned higher on the chart are pursuing more restrictive policies, while those lower on the chart are more expansionary.
주요 시사점:
- Contractive policies aim to reduce inflation but may slow growth.
- Neutral policies maintain current economic conditions without significant changes.
- Expansionary policies stimulate growth and may increase inflation.
- Countries like Ukraine, Brazil, 그리고 Thailand show a tightening bias, while Euro Area 그리고 Japan are more expansionary.
정보의 응용:
Understanding a country’s monetary policy stance is essential for predicting economic performance. Investors can use this information to anticipate interest rate changes, inflation trends, 그리고 잠재력 investment opportunities based on how policy affects markets.
G. Global Business Cycle Phases
Global: Business Cycle Phases and Macroeconomic Indicators
그만큼 global business cycle, like national and regional cycles, follows the phases of expansion, peak, contraction, 그리고 구유, but on a much larger scale. These cycles are influenced by macroeconomic factors that span across continents and are affected by the interplay of economies worldwide. Here’s a deeper look at how each phase unfolds and the key indicators that signal their onset.
- 확장 단계:
During the global expansion phase, economies around the world experience growth. This is marked by rising global GDP, increased consumer spending, job creation, and rising levels of production. Expansion is fueled by a combination of low 이자율, technological innovation, and strong international trade relations. Central banks, such as the Federal Reserve (U.S.), the European Central Bank (ECB), 그리고 People’s Bank of China, tend to keep interest rates low during this phase to encourage borrowing and investment.
Key indicators of global expansion include:
- Global GDP Growth: Rising global GDP is a primary sign of global expansion, often driven by growth in major economies like the U.S., China, and the Eurozone.
- Employment Growth: As companies expand production, global unemployment rates fall. This phase typically sees higher job creation across industries.
- Commodity Prices: Demand for raw materials, such as oil, copper, and agricultural products, increases, driving up commodity prices. This is often a reflection of expanding manufacturing activity and consumer demand.
For example, the global expansion phase after the 2008 financial crisis saw increased investment in emerging markets like India and Brazil, along with significant technological advances that spurred growth worldwide.
2. Peak Phase:
The global peak occurs when economies reach the height of their growth. During this phase, economic indicators may show signs of overheating, such as high inflation rates and labor markets nearing full employment. Global central banks may raise interest rates to slow down economic activity and prevent inflation from spiraling out of control. This period is also characterized by high commodity prices, driven by strong demand.
Indicators signaling the peak of the global business cycle include:
- Rising Inflation: As economies grow, increased demand for goods and services can push inflation beyond the target rates set by central banks.
- Tight Labor Markets: Global unemployment rates are at their lowest during this phase, leading to upward pressure on wages as employers compete for labor.
- Interest Rate Increases: Major central banks, including the Federal Reserve and the ECB, may raise interest rates to control inflation and moderate the pace of economic growth.
The global peak of the mid-2000s, for instance, was characterized by rapidly rising asset prices, especially in housing and commodities, before the eventual slowdown.
3. Contraction Phase:
Global contraction occurs when economic activity begins to slow. This is often triggered by rising interest rates, declining demand, or external shocks such as geopolitical tensions or trade wars. During this phase, global GDP 성장 slows or contracts, unemployment rises, and both consumer spending and investment decrease. For commodity-exporting nations, declining commodity prices can worsen the contraction, as global demand for raw materials wanes.
Indicators of a global contraction include:
- Declining Global GDP: As consumer and business spending slow, global GDP growth decelerates or turns negative.
- Rising Unemployment: Companies begin to lay off workers or freeze hiring, leading to higher unemployment across major economies.
- Falling Commodity Prices: Reduced demand for commodities leads to price declines in oil, metals, and other raw materials, impacting both producer and consumer countries.
The contraction phase can be exacerbated by external shocks, such as the 2020 COVID-19 pandemic, which led to widespread business shutdowns, reduced global trade, and a sharp contraction in GDP.
4. Trough Phase:
At the global trough, economic activity bottoms out. Global GDP may be stagnant or shrinking, unemployment is high, and central banks typically reduce interest rates to stimulate economic recovery. This phase often sees quantitative easing or other extraordinary monetary measures implemented by central banks to increase liquidity and encourage borrowing and investment.
Key indicators of the trough include:
- 낮은 이자율: Central banks reduce interest rates, sometimes to near-zero levels, to stimulate borrowing and encourage businesses to invest.
- Quantitative Easing: In an attempt to revive growth, central banks may inject money into the economy by purchasing bonds and other financial assets, increasing liquidity.
- Weak Consumer Confidence: Global consumer confidence tends to be at its lowest during the trough, reflecting high levels of uncertainty about the future.
- Rising Public Debt: Governments often increase spending during the trough to stimulate demand, leading to higher public debt levels.
The global economy typically emerges from the trough through coordinated efforts by governments and central banks, such as the joint stimulus measures seen after the 2008 financial crisis and the global response to the COVID-19 pandemic.

수치: Business Cycle Phases (Real GDP, Unemployment, and Inflation)
설명:
This figure illustrates the 경기 순환 단계 through three graphs: Real GDP, 실업률, 그리고 인플레이션율. The top graph shows Real GDP increasing during an expansion, peaking, then declining during a contraction (recession), reaching a 구유, and finally rising again. The second graph represents the 실업률, which moves inversely to Real GDP: rising during contractions and falling during expansions. The third graph displays inflation rate trends, which typically rise during expansions and decrease during contractions.
주요 시사점:
- Real GDP increases during economic expansions and decreases during contractions, reflecting overall economic health.
- Unemployment rates rise during contractions and fall during expansions, indicating changes in labor market conditions.
- Inflation rates generally increase during expansions as demand rises and decrease during contractions due to reduced demand.
- The business cycle progresses through peak, 구유, contraction, 그리고 expansion phases.
정보의 응용:
이해하기 사업주기 is essential for investors to anticipate 시장 경향 and adjust their strategies accordingly. By analyzing Real GDP, unemployment, and inflation, investors can gauge the economic environment and make informed decisions about asset allocation, 위기 관리, 그리고 investment timing. Recognizing these cycles helps in identifying potential entry and exit points in markets.
결론
Understanding both local and global macroeconomic factors is essential for making informed investment decisions. By analyzing economic indicators, monetary and fiscal policies, and the impact of these factors on different industries and business cycles, investors can better navigate the complexities of global and European markets.
주요 수업 정보:
- 이자율: Low interest rates generally stimulate economic growth by making borrowing cheaper, which can boost stock markets. Conversely, high interest rates might slow down the economy and can lead to declines in stock prices.
- 인플레이션: Moderate inflation is often a sign of a healthy economy, but high inflation can lead to uncertainty and reduced consumer spending, negatively affecting stock markets.
- Government Fiscal Policy: Expansionary fiscal policies, such as increased government spending and tax cuts, can stimulate economic growth, particularly during downturns. Contractionary fiscal policies might be used to cool an overheating economy.
- Global Trade and Supply Chains: Stability in international trade and efficient supply chains contribute to economic growth, while disruptions can cause significant volatility in stock markets.
- Monetary Policy Beyond Interest Rates: Tools like quantitative easing, which involve central banks purchasing financial assets to inject money into the economy, can lower interest rates further and boost stock market liquidity.
마무리 진술:
By understanding these macroeconomic factors and their influence on the business cycle, stakeholders can better navigate the complexities of global markets. This knowledge aids in strategic decision-making, allowing for more effective risk management and investment planning in response to changing economic conditions.
