
Global: Measuring Risk and Understanding Volatility
수업 학습 목표:
- Understand the difference between risk and volatility. You’ll learn how 위험 relates to the chance of losing money and how volatility reflects the ups and downs of asset prices over time.
- Learn how to measure risk using standard deviation and beta. These tools help you understand how much an investment’s price might change, and how it moves in relation to the market.
- Explore how personal risk tolerance affects investment decisions. You’ll see how age, goals, income, and emotional comfort with risk help shape a portfolio that feels right for you.
- Discover common tools for measuring portfolio risk. Techniques like 위험 가치(VaR), 샤프비율, 그리고 scenario analysis help you understand possible outcomes and worst-case scenarios.
- Recognize different types of investment risks. You’ll learn about market risk, credit risk, liquidity risk, and more, and how knowing these risks helps you protect your money through better strategies.
A. Measuring Risk and Understanding Volatility
Risk and volatility are inherent parts of investing. While risk refers to the potential for losing part or all of an investment, volatility refers to the degree of price fluctuations over time. Measuring risk helps investors understand the likelihood of adverse outcomes, while understanding volatility helps them gauge the stability or instability of asset prices.
- Volatility as a Risk Indicator: Volatility is one of the most commonly used indicators of risk. High volatility means the price of a security can change dramatically over a short period, which may offer high rewards but also high risk. Conversely, low volatility suggests more stability in the asset’s price.
- 표준 편차: This is a key metric used to measure volatility. It calculates the variation in an asset’s returns from its average over time. Higher standard deviation means more volatility and, therefore, more risk.
- 베타: Beta measures how a stock’s volatility compares to the market as a whole. A beta of 1 indicates that the stock moves with the market. A beta greater than 1 implies higher volatility, while a beta less than 1 suggests lower volatility.
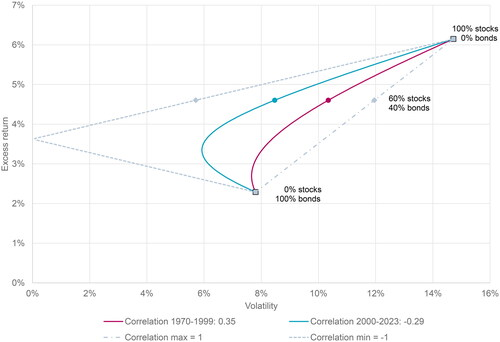
수치: Correlation Between Stocks and Bonds: Historical vs. Recent (1970-2023)
설명:
The chart illustrates the relationship between excess return 그리고 volatility of different portfolios composed of stocks and bonds over two distinct periods: 1970-1999 (represented in red) and 2000-2023 (represented in blue). The chart shows how changes in correlation between stocks and bonds affect the portfolio’s risk-return profile. The curved lines indicate the optimal portfolio mix for each period, with labeled points highlighting key combinations such as 100% stocks, 60% stocks/40% bonds, 그리고 0% stocks/100% bonds. The dotted lines represent maximum and minimum correlations between stocks and bonds.
주요 시사점:
- From 1970 to 1999, the correlation between stocks and bonds was positive (0.35), indicating that stocks and bonds tended to move together.
- From 2000 to 2023, the correlation between stocks and bonds became negative (-0.29), suggesting that they often moved in opposite directions.
- 그만큼 negative correlation observed in recent years offers better diversification benefits, reducing portfolio volatility.
- The optimal 60/40 stocks-bonds portfolio provides a balanced risk-return trade-off, with lower volatility compared to an all-stock portfolio.
정보의 응용:
이해하기 changing correlation between stocks and bonds helps investors adjust their asset allocation strategies. During periods of negative correlation, a mix of stocks and bonds can enhance 포트폴리오 다양화, offering risk reduction without significantly compromising returns. This insight is valuable for investors looking to build resilient portfolios that can adapt to varying market conditions and improve overall risk-adjusted performance.
B. Personal Risk Tolerance
Personal risk tolerance refers to the level of risk an individual is comfortable taking when investing. Understanding risk tolerance is crucial for creating a portfolio that aligns with an investor’s goals, financial situation, and emotional comfort with market fluctuations.
- Assessing Risk Tolerance: Risk tolerance varies from person to person, influenced by factors such as age, investment goals, income, and personal circumstances. Younger investors may have higher risk tolerance due to a longer time horizon, while retirees may prefer less risk and focus on capital preservation.
- Emotional Comfort with Risk: It’s important to assess how comfortable an investor is with market volatility. Some may panic during downturns and sell investments at a loss, while others may be able to ride out market volatility for long-term gains.
- Balancing Risk and Reward: Higher-risk investments, such as stocks, offer the potential for higher returns but also greater potential for losses. Low-risk investments, such as bonds or cash equivalents, provide more stability but typically offer lower returns. Investors must find a balance between risk and reward that matches their risk tolerance.
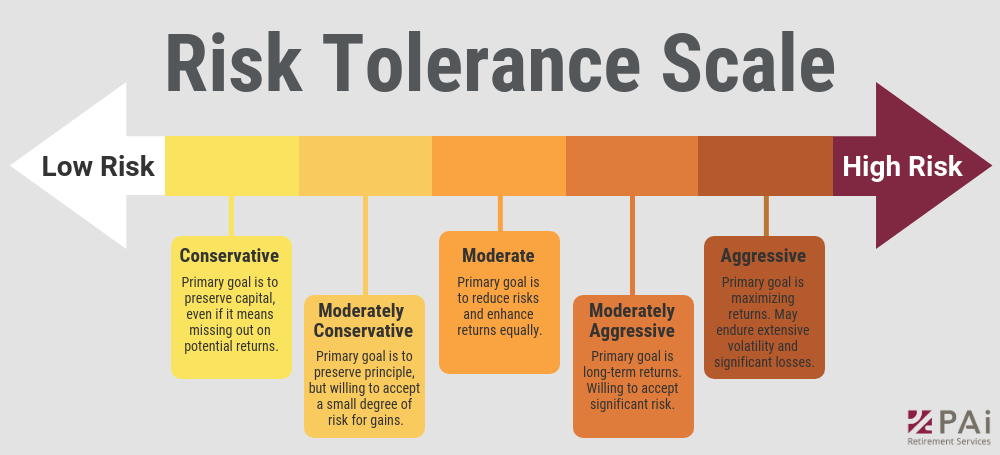
수치: Risk Tolerance Scale
설명:
This figure displays a risk tolerance scale ranging from low risk 에게 high risk, represented by an arrow that moves from left to right. The scale categorizes risk tolerance into five levels: 보수적인, Moderately Conservative, 보통의, 적당히 공격적, 그리고 공격적인. Each level includes a brief description of the primary investment goal and willingness to accept risk vs. return. The conservative side focuses on preserving capital, while the aggressive side aims for maximizing returns, with a willingness to endure higher volatility.
주요 시사점:
- Conservative investors prioritize capital preservation and are less concerned with returns.
- Moderately conservative investors seek to preserve capital while accepting limited risk for small gains.
- Moderate investors balance risk and returns equally.
- Moderately aggressive investors focus on long-term growth, accepting significant risk.
- Aggressive investors aim for maximum returns, willing to face extensive volatility and potential losses.
정보의 응용:
Understanding your 위험 감수 helps determine an appropriate investment strategy. It is crucial to align your portfolio with your financial goals, time horizon, 그리고 comfort level regarding potential losses. This framework can guide decisions, helping to create a well-balanced portfolio tailored to personal preferences and financial objectives.
C. Risk Measurement Techniques
Risk measurement techniques help investors quantify and manage the risks in their portfolios. Here are some of the most commonly used techniques:
- 위험 가치(VaR): VaR estimates the potential loss in an investment portfolio over a given period for a certain level of confidence. For example, a 5% VaR of $1 million means there is a 5% chance the portfolio will lose more than $1 million over the specified period.
- 샤프비율: The 샤프비율 measures the risk-adjusted return of an investment by comparing its excess return over a risk-free asset to the investment’s volatility. A higher Sharpe ratio indicates better risk-adjusted performance.
- Maximum Drawdown: This measures the largest drop from a peak to a trough in the value of a portfolio. Understanding the maximum drawdown helps investors gauge the potential worst-case scenario for their portfolio.
- Scenario Analysis and Stress Testing: These techniques evaluate how a portfolio might perform under different hypothetical scenarios, such as economic downturns, rising interest rates, or geopolitical crises.
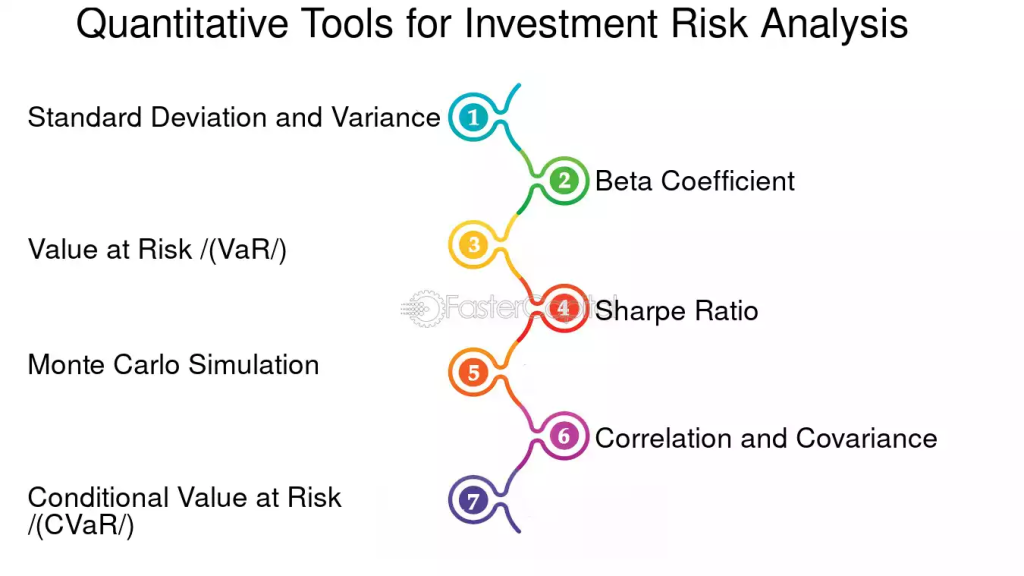
수치: Quantitative Tools for Investment Risk Analysis
설명:
This diagram presents seven key tools used to measure and analyze investment risk. The tools include Standard Deviation and Variance, which assess the spread of returns; the Beta Coefficient, which measures an asset’s sensitivity to market movements; 위험 가치(VaR), estimating potential losses in adverse conditions; and the 샤프비율, which evaluates risk-adjusted returns. Other tools include Monte Carlo Simulation for modeling potential outcomes, Correlation and Covariance for examining asset relationships, and Conditional Value at Risk (CVaR) for analyzing extreme loss scenarios.
주요 시사점:
- Standard Deviation and Variance provide insights into the volatility of returns.
- 그만큼 Beta Coefficient helps measure an investment’s responsiveness to overall market risk.
- 위험 가치(VaR) 그리고 Conditional Value at Risk (CVaR) are essential for understanding potential losses during extreme market movements.
- 그만큼 샤프비율 is a valuable tool for assessing the return an investor receives per unit of risk.
- Monte Carlo Simulation 그리고 Correlation/Covariance aid in understanding potential outcomes and relationships between assets.
정보의 응용:
Investors can use these tools to better understand and manage investment risks by applying them to analyze the volatility, correlation, 그리고 potential losses of their portfolios. These tools provide a foundation for making informed decisions, optimizing portfolios, and tailoring strategies based on 위험 감수 그리고 market conditions.
D. Risk Categories
Investors face different types of risk, each requiring a different approach for management. Understanding the various risk categories allows investors to make informed decisions and build resilient portfolios.
- Market Risk: The risk that the value of investments will fluctuate due to market-wide factors, such as economic changes, political events, or changes in interest rates. Stocks are highly susceptible to market risk.
- Credit Risk: The risk that a bond issuer or borrower may default on its debt obligations. This is particularly relevant for bondholders and lenders. Credit risk increases with bonds issued by lower-rated companies or countries.
- Liquidity Risk: The risk that an investor will not be able to buy or sell an investment quickly enough without affecting its price. Small-cap stocks or real estate are often more affected by liquidity risk.
- Interest Rate Risk: The risk that changes in interest rates will affect the value of bonds or other fixed-income investments. Rising interest rates tend to lower the value of existing bonds, while falling rates increase bond prices.
- Inflation Risk: The risk that inflation will erode the purchasing power of investment returns. Inflation affects cash and fixed-income investments the most, as they may not keep pace with rising prices.
- Currency Risk: For international investors, currency risk arises when the value of the foreign currency in which an investment is denominated fluctuates relative to the investor’s home currency.
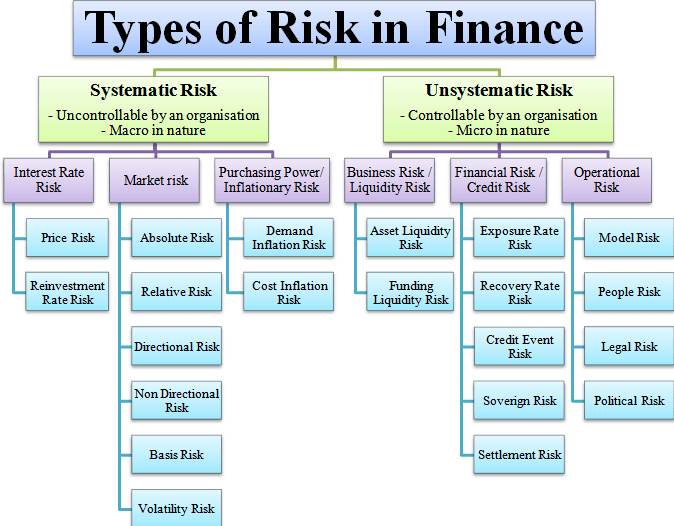
수치: Types of Investment Risk: Systematic vs. Unsystematic
설명:
This diagram illustrates two primary categories of financial risk: Systematic Risk 그리고 Unsystematic Risk. Systematic Risk refers to macro-level risks that affect the entire market and are beyond the control of any organization. It includes factors like interest rate risk, market risk, 그리고 inflationary risk. On the other hand, Unsystematic Risk is specific to a company or industry and can be managed or reduced. This category includes risks such as business/liquidity risk, credit risk, 그리고 operational risk.
주요 시사점:
- Systematic Risk affects the entire market and cannot be eliminated by diversification.
- Interest rate risk, market risk, 그리고 inflationary risk are examples of systematic risks.
- Unsystematic Risk is specific to a company or industry and can be reduced through diversification.
- Business risk, credit risk, 그리고 operational risk fall under unsystematic risks.
- Understanding these risks helps investors in better 위기 관리 그리고 포트폴리오 다양화.
정보의 응용:
This information is useful for investors to differentiate between risks that can be controlled (unsystematic) and those that cannot (systematic). By knowing the types of risks, investors can develop risk management strategies such as 다각화 to mitigate unsystematic risks and enhance overall portfolio resilience.
결론
Effective risk management is essential for building a strong, resilient investment portfolio. Understanding how to measure risk, assess personal risk tolerance, and apply different risk measurement techniques can help investors navigate market volatility and avoid unnecessary losses. By categorizing risks—such as market, credit, liquidity, and interest rate risks—investors can develop strategies to mitigate those risks and achieve long-term financial goals. Diversifying investments across asset classes and geographic regions remains one of the most effective ways to manage risk while maximizing returns.
주요 수업 정보:
- Volatility is a key indicator of risk. High volatility means an investment’s price moves a lot and can bring higher rewards or bigger losses. Tools like standard deviation 그리고 beta help measure how risky or stable an investment is.
- Personal risk tolerance shapes your investment choices. Some people are more comfortable with risk, while others prefer stability. Using a risk tolerance scale—from conservative to aggressive—helps match your investments to your comfort level and goals.
- Risk measurement tools help you plan for uncertainty. 위험 가치(VaR) estimates possible losses in bad markets. The 샤프비율 shows how much return you get for each unit of risk. Scenario analysis helps you see how your portfolio might perform in real-world events.
- Different risk categories need different strategies. Market risk affects all investments and can’t be avoided, but unsystematic risks, like credit or business risk, can be reduced through 다각화. Knowing the difference helps you build a stronger portfolio.
- The relationship between stocks and bonds changes over time. From 2000 to 2023, stocks and bonds had a negative correlation, meaning when one dropped, the other often rose. This made a balanced 60/40 portfolio more effective for reducing volatility while maintaining good returns.
마무리 진술:
Understanding how to measure and manage risk helps you stay in control of your investments. This section provides the tools and knowledge you need to make more confident and informed decisions in any market condition.
