
Local: Measuring Risk and Understanding Volatility
수업 학습 목표:
- Understand Beta: Learn how 베타 reflects a stock’s volatility compared to the overall market. You’ll explore how market fragmentation 그리고 ECB monetary policies can affect a company’s Beta in different Eurozone countries.
- Explore sector volatility: Discover how different regulated sectors, 와 같은 Telecommunications 그리고 Water, perform in terms of returns and risk using Beta analysis. You’ll be able to spot which sectors are more stable or risky.
- Learn Alpha fundamentals: Understand how 알파 measures the extra returns of an investment after adjusting for market risk. This helps you identify companies or sectors that may outperform the market.
- Evaluate local factors: See how economic disparities 그리고 EU-wide regulations 좋다 MiFID II impact Alpha. You’ll learn how companies in different countries may perform better or worse depending on growth opportunities 그리고 policy support.
- Apply insights to investing: Learn how to use Beta and Alpha data from charts and tables to make smarter decisions about sector exposure 그리고 agriculture or stock investments within the Eurozone.
Measuring Risk and Understanding Volatility
When analyzing Eurozone companies, investors must consider region-specific factors in their risk assessment tools, such as 베타, 알파, 그리고 샤프비율. These metrics, while globally applicable, have unique implications within the context of European markets due to differences in market structure, regulation, and economic conditions across EU countries.
12.1 Beta in the Eurozone
베타 measures a stock’s volatility relative to the broader market, typically using a benchmark index like the Euro Stoxx 50 or the FTSEurofirst 300. In the Eurozone, Beta is influenced by both local and regional factors:
- Market Fragmentation: The Eurozone consists of multiple countries with distinct economic conditions. A company’s Beta may be more sensitive to the specific economic health of its home country or the broader Eurozone, depending on its market exposure.
- For example, a German company with a Beta above 1 might experience heightened volatility due to its exposure to the highly export-driven German economy, which is sensitive to global trade dynamics and fluctuations in the euro.
- For example, a German company with a Beta above 1 might experience heightened volatility due to its exposure to the highly export-driven German economy, which is sensitive to global trade dynamics and fluctuations in the euro.
- ECB Policies: Monetary policies from the European Central Bank (ECB), such as interest rate adjustments or quantitative easing, can have an outsized impact on companies’ Beta in the Eurozone. Companies in sectors like financial services may exhibit higher volatility when interest rates are expected to change.
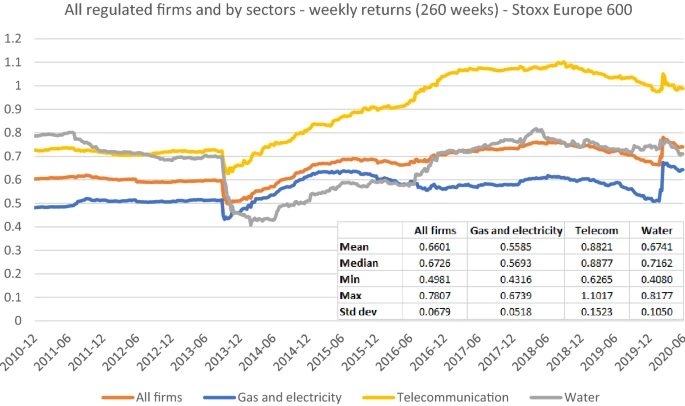
수치: All Regulated Firms and by Sectors – Weekly Returns (260 weeks) – Stoxx Europe 600
설명:
This line graph shows the weekly returns of regulated firms across different sectors within the Stoxx Europe 600 index over a period from 2010 to mid-2020. The sectors include Gas and Electricity, Telecommunication, 그리고 Water, compared against the returns of All Firms within the index. The chart tracks mean, median, minimum, maximum, and standard deviation of returns. Notable fluctuations and differences in performance are visible among the sectors, with Telecommunication experiencing higher returns compared to other sectors, while Water remains relatively stable with the lowest volatility.
주요 시사점:
- Telecommunication has the highest weekly returns over the observed period, with both high mean and median values.
- Gas and Electricity exhibit moderate returns but have the least volatility among the sectors.
- 그만큼 Water sector displays the lowest returns but also the lowest volatility, indicating a more stable performance.
- All Firms maintain a consistent return pattern over time but do not achieve the highs seen in the Telecommunication sector.
- The standard deviation of returns varies across sectors, highlighting different levels of risk and stability.
정보의 응용:
This data is useful for 투자자들 looking to understand the risk-return trade-off in different regulated sectors within the European market. It can help investors identify stable sectors 좋다 Water for lower-risk portfolios or more volatile sectors 좋다 Telecommunication for potentially higher returns. The analysis provides insights into sector-specific performance and can inform diversification strategies based on sector stability and returns.
12.2 Alpha in the Eurozone
알파 measures the excess return of an investment relative to a benchmark, accounting for market risk. In the Eurozone, Alpha analysis for companies is impacted by region-specific factors:
- Economic Disparities: Different countries in the Eurozone experience varying levels of economic growth, inflation, and debt. A company operating in a high-growth country like Germany 또는 the Netherlands may generate higher Alpha compared to a company based in a slower-growing economy like Italy 또는 Greece.
- 규제 환경: EU-wide regulations, such as MiFID II (Markets in Financial Instruments Directive), affect company operations and investor protections, potentially influencing a company’s ability to generate Alpha. For instance, companies in the renewable energy sector may benefit from favorable EU policies, generating higher Alpha relative to their peers.
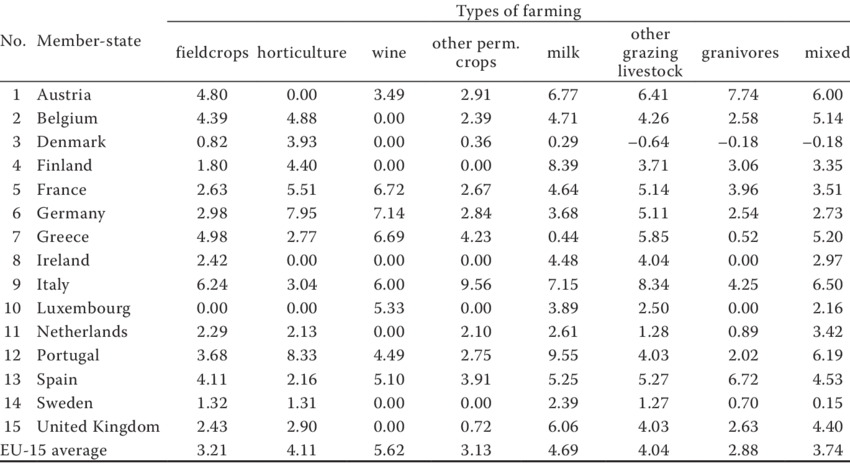
수치: Average Sharpe Ratios in the EU-15 Farms by Member States and Types of Farming
설명:
This table presents the average Sharpe ratios for various types of farming across 15 EU member states. The Sharpe ratio measures the performance of an investment compared to a risk-free asset, adjusted for risk. The table covers different farming categories, including field crops, horticulture, wine, other permanent crops, milk, other grazing livestock, granivores, 그리고 mixed farming. The values indicate the efficiency of risk-adjusted returns for each type of farming within the given member states. The EU-15 average for each farming category is also provided.
주요 시사점:
- Horticulture generally has the highest Sharpe ratios among farming types, especially in Germany (7.95) and Portugal (8.33), indicating strong risk-adjusted returns.
- Mixed farming tends to have relatively balanced Sharpe ratios across countries, with Italy (6.50) and Spain (5.64) performing well in this category.
- Granivores 그리고 other grazing livestock have more variable Sharpe ratios, reflecting higher volatility and differences in risk-adjusted performance among member states.
- The EU-15 average reveals that wine 그리고 horticulture have the highest average Sharpe ratios (5.62 and 4.11, respectively), suggesting these types of farming may offer better risk-adjusted returns on average.
정보의 응용:
This data can guide agricultural investors or policy makers in identifying which types of farming offer the best risk-adjusted returns across different EU member states. Understanding the performance dynamics across farm types and countries allows for better allocation of resources and investment in more promising sectors. It also helps potential farmers and investors evaluate the risk efficiency of various agricultural ventures within the EU.
결론
Measuring risk and understanding volatility in the Eurozone requires careful consideration of EU-specific economic, political, and regulatory factors. 베타, 알파, 그리고 샤프비율 are essential tools for assessing risk and return in Eurozone companies, but their interpretation must account for local market dynamics, ECB monetary policies, and regional economic disparities. By understanding these metrics in the context of European markets, investors can make more informed decisions about their portfolio’s exposure to Eurozone companies and manage risk more effectively.
주요 수업 정보:
- Beta measures volatility, helping investors understand how much a stock’s price might move compared to the market. In the Eurozone, market fragmentation and a company’s country exposure can greatly influence Beta values.
- ECB monetary policies, such as interest rate changes, can strongly impact Beta, especially in sensitive sectors 좋다 financial services. This shows how central bank actions play a key role in market behavior.
- Sector data from the Stoxx Europe 600 reveals that Telecommunication had the highest returns but also higher risk, while the Water sector had lower returns ~와 함께 greater stability. This helps investors match their portfolio with their 위험 감수.
- Alpha shows extra returns beyond the market average. In the Eurozone, countries with stronger economies 좋다 Germany may offer higher Alpha, especially when companies operate in fast-growing sectors.
- EU regulations like MiFID II affect company performance and investor protections, which can influence Alpha. Sectors like renewable energy may benefit from favorable policies, making them more likely to outperform.
- The farming Sharpe ratio table shows that horticulture and wine farming 권하다 better risk-adjusted returns in many countries. Investors and policymakers can use this data to make better agricultural investment decisions and allocate resources more efficiently.
마무리 진술:
Understanding Beta and Alpha in the Eurozone allows you to make better-informed investment decisions. These tools help you measure volatility, spot potential returns, and evaluate how regional differences and sector trends affect financial performance.
