
Introduction to Technical Analysis
수업 학습 목표:
소개: In this chapter, we’ll explore 기술적 분석, a method used to evaluate securities by analyzing past price and volume data. You’ll learn about various tools and concepts that can help predict future price movements in stock investing.
- 이해하다 the fundamentals of price charts and their types, such as line, bar, and candlestick charts, which form the basis of technical analysis.
- 배우다 ~에 대한 trendlines and their role in identifying the direction of a trend and potential support and resistance levels.
- 탐구하다 개념 support and resistance levels, crucial in forecasting price movements and making trading decisions.
- 파악 the use of moving averages and how they help in identifying trends and potential trend reversals.
- 발견하다 various technical indicators like RSI, MACD, and Bollinger Bands, which assist in identifying trade opportunities.
- 인정하다 different chart patterns and their significance in signaling trend continuations or reversals.
- 고마워하다 the importance of different timeframes in technical analysis and how they align with various trading strategies.
Technical analysis is a method of evaluating securities by analyzing past price and volume data to predict future price movements. This approach is based on the belief that historical price patterns and trends can help forecast future market behavior. In this chapter, we’ll introduce key concepts in technical analysis and explain how they can be applied to stock investing. Remember, we also offer a separate, detailed course on technical analysis for those who wish to delve deeper.
- Price Charts: Price charts are the foundation of technical analysis, as they visually display historical price and volume data. The most commonly used charts are line charts, bar charts, and candlestick charts. Each chart type provides different information and serves specific purposes.
- Trendlines: Trendlines are straight lines drawn on a price chart to connect a series of highs or lows, indicating the direction of a trend. An upward trendline connects successive higher lows, while a downward trendline connects lower highs. These lines help traders identify potential support and resistance levels.
- Support and Resistance: Support and resistance levels are horizontal lines on a chart that represent price levels where buying or selling pressure is likely to occur. Support levels indicate where demand is strong enough to prevent further price declines, while resistance levels suggest selling pressure that may limit price increases.
- Moving Averages: Moving averages are widely used technical indicators that smooth out price data to identify trends over a specific period. The most common types are simple moving averages (SMA) and exponential moving averages (EMA). Moving averages can act as support or resistance levels and help identify trend reversals.
- Technical Indicators: Technical indicators are mathematical calculations based on price and volume data that help traders identify potential trade opportunities. Some popular indicators include the Relative Strength Index (RSI), Moving Average Convergence Divergence (MACD), and Bollinger Bands.
- Chart Patterns: Chart patterns are specific price formations that can signal trend reversals or continuations. Common patterns include head and shoulders, double tops and bottoms, and triangles. Recognizing these patterns can help traders anticipate future price movements.
- Timeframes: Technical analysis can be applied to various timeframes, from intraday to long-term. Short-term traders may focus on minute or hourly charts, while long-term investors might analyze daily, weekly, or monthly charts. The choice of timeframe depends on the individual’s trading strategy and objectives.
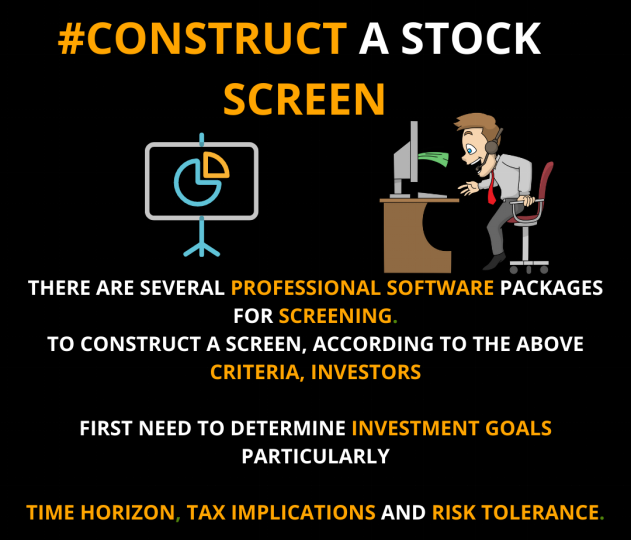
수치: The infographic outlines the steps and considerations involved in constructing a stock screen. It emphasizes the importance of professional software packages for screening and highlights the need for investors to first determine their investment goals. Key factors to consider include the time horizon, tax implications, and risk tolerance. The visual representation underscores the methodical approach required for effective stock screening.
출처: 맞춤형 인포그래픽
Technical analysis can be a valuable tool for stock investors, providing insights into market sentiment and potential price movements. By mastering these key concepts and incorporating technical analysis into your investment process, you can make more informed decisions and potentially improve your trading results.
21.1 Top-Down and Bottom-Up Investing
Top-down 그리고 bottom-up investing are two distinct approaches to building an investment portfolio. These methods help investors understand the macroeconomic environment and individual company fundamentals to make informed investment decisions. In this chapter, we will discuss the pros and cons, key concepts, and research methodologies for both top-down and bottom-up investing. We will also outline step-by-step plans to help you develop a strategy for each approach.
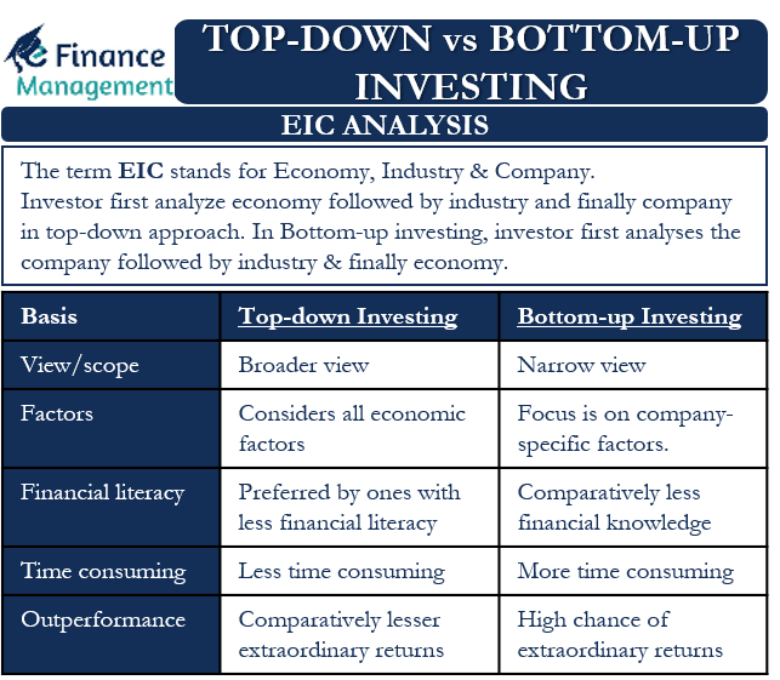
그림 제목: Top-Down vs Bottom-Up Investing
설명: The figure compares two approaches to investing: top-down and bottom-up. It visually represents the steps taken in each approach, from examining the economy to analyzing individual companies.
주요 시사점:
- Approach in Top-Down: Starting with Economy, followed by Industry, and finally looking at the Company.
- Bottom-Up: The focus starts with individual companies, then broadens to industry and economy.
애플리케이션: Understanding the difference between top-down and bottom-up investing is crucial for investment strategy. Investors can use either or both to suit their investment goals and risk tolerance.
21.1.1 Top-Down Investing
Top-down investing focuses on identifying macroeconomic trends and their impact on specific sectors and industries before analyzing individual companies. By understanding the broader economic context, investors can make informed decisions on which industries are likely to outperform or underperform the market.
장점:
- Allows investors to identify sectors and industries that may benefit from macroeconomic trends
- Provides a broad perspective on the market, which can help avoid concentration risk
단점:
- May overlook strong companies within underperforming industries
- Macro trends can be challenging to predict and may change rapidly
Key Concepts and Research Methodology:
1 단계: Analyze global macroeconomic indicators such as GDP growth, inflation, interest rates, and currency movements to understand the overall economic environment.
Step 2: Identify sectors and industries that may benefit from or be negatively impacted by the macroeconomic trends observed in step 1.
3단계: Research individual companies within the selected sectors and industries. Evaluate their financial health, competitive advantages, and growth prospects.
Step 4: Build a diversified portfolio of stocks from the chosen industries, ensuring proper risk management and diversification.
Important Things to Know:
- Top-down investing begins with macroeconomic analysis
- Identifying sectors and industries poised to benefit from macro trends is crucial
- Top-down investing helps manage concentration risk
- The individual stock selection remains essential even within favorable industries
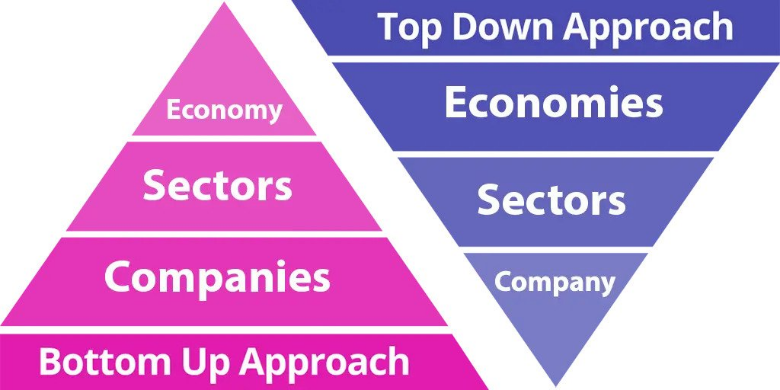
Figure title: Comparative Analysis of Top-Down and Bottom-Up Investing
원천: TSI Network
설명: This figure visually lays out the sequential steps involved in both top-down and bottom-up investing strategies. It illustrates the hierarchy of factors each strategy considers, starting with the economy down to individual companies or vice versa.
주요 시사점:
- Bottom-Up Strategy: Investors focusing on this strategy start by examining specific companies’ performance, financials, and market presence. They then move on to the sector and finally the overall economy.
- Top-Down Strategy: Investors start by assessing macroeconomic indicators like GDP, interest rates, and market cycles. Next, they zero in on promising sectors and ultimately choose companies within those sectors.
- Different Focus: Bottom-up concentrates more on company performance, while top-down gives precedence to economic and sectoral trends.
애플리케이션: Depending on your investment objectives and comfort with risk, you can choose a strategy that best aligns with your goals. Understanding these two approaches offers a framework for systematic investment.
21.1.2 Bottom-Up Investing
Bottom-up investing focuses on analyzing individual companies, emphasizing their fundamentals, growth prospects, and competitive advantages. Investors using this approach seek to identify well-managed companies with strong financial health, irrespective of the broader economic environment.
장점:
- Focuses on company-specific factors, which can lead to finding undervalued stocks
- Can uncover hidden gems within underperforming sectors or industries
단점:
- May overlook broader macroeconomic trends that could affect the company’s performance
- This can result in over-concentration in certain sectors or industries
Key Concepts and Research Methodology:
Step 1: Screen for companies based on specific financial criteria, such as valuation metrics, profitability, and growth rates.
2 단계: Perform an in-depth analysis of the company’s business model, competitive advantages, management team, and industry position.
Step 3: Analyze financial statements to assess the company’s financial health, including revenue and earnings growth, profit margins, and debt levels.
Step 4: Determine a fair valuation for the stock based on various valuation methods, such as discounted cash flow or price-to-earnings multiples.
Step 5: Construct a diversified portfolio of high-quality stocks identified through bottom-up analysis, ensuring proper risk management and diversification.
Important Things to Know:
- Bottom-up investing focuses on individual company analysis
- Financial statement analysis is crucial in evaluating a company’s health
- Understanding a company’s competitive advantages and industry position is essential
- Diversification remains important to manage risk in a bottom-up investing approach
In conclusion, top-down and bottom-up investing are two distinct strategies that can help investors build well-rounded portfolios. By understanding the strengths and weaknesses of each approach and developing a clear plan, investors can make informed decisions that align with their investment goals and risk tolerance.
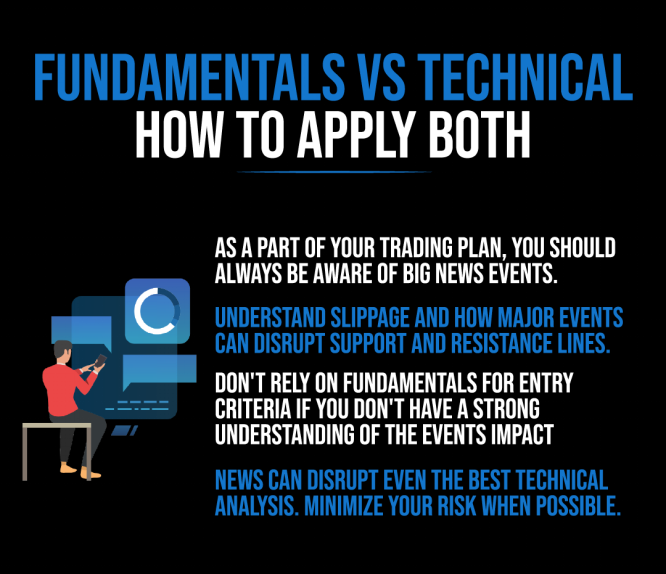
수치: The infographic delves into the interplay between “Fundamentals” and “Technical” analysis in trading. It emphasizes the importance of being aware of significant news events as part of a trading plan. The visual guide advises traders to understand the impact of slippage and how major events can disrupt established support and resistance lines. It cautions against relying solely on fundamentals for entry criteria without a deep understanding of the event’s impact. The infographic concludes by noting that news can disrupt even the most robust technical analysis, urging traders to minimize risk whenever possible.
출처: 맞춤형 인포그래픽
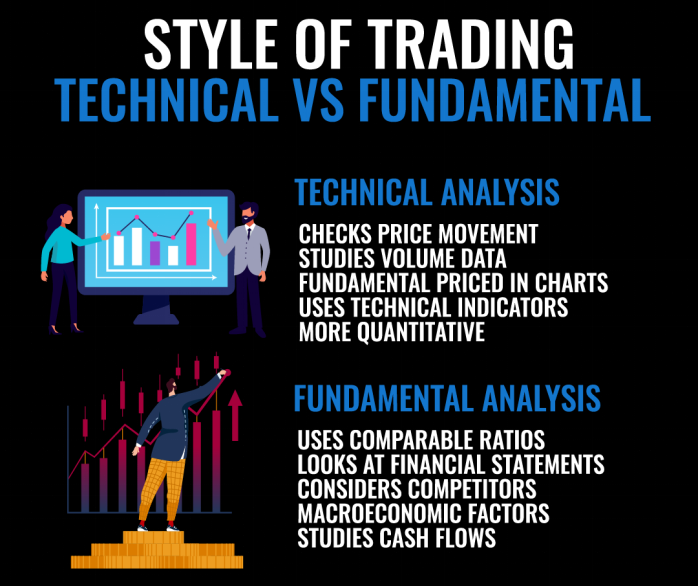
수치: The infographic contrasts “Technical Analysis” with “Fundamental Analysis” in the context of trading styles. Under Technical Analysis, the focus is on checking price movement, studying volume data, understanding that fundamentals are priced in charts, and using technical indicators. It is described as more quantitative. On the other hand, Fundamental Analysis emphasizes using comparable ratios, examining financial statements, considering competitors, taking into account macroeconomic factors, and studying cash flows.
출처: 맞춤형 인포그래픽
21.2 Buy & Hold vs. Active Trading
21.2.1 Buy & Hold Investing:
Buy and hold investing is a long-term investment strategy where investors purchase stocks or other assets and hold them for an extended period, regardless of market fluctuations. The belief is that, over time, the market will generate positive returns, and the power of compounding will help build wealth.
장점:
- Lower transaction costs: Long-term investors incur fewer trading fees and taxes due to less frequent trading.
- Time in the market: Buy and hold investors benefit from market growth and compound interest over time.
- Lower stress: This strategy requires less active management, reducing the emotional stress of constantly monitoring the market.
- Reduced risk of market timing errors: By not attempting to time the market, investors avoid the risk of buying high and selling low.
단점:
- Potential for missed opportunities: Investors may miss out on profitable short-term trades by not actively managing their portfolio.
- Lack of flexibility: Buy and hold investors may hold onto underperforming stocks for too long, resulting in lost potential gains.
21.2.2 Active Trading:
활발한 거래 is a more hands-on approach where investors frequently buy and sell assets to capitalize on short-term market fluctuations. Active traders aim to generate higher returns by profiting from market inefficiencies and trends.
장점:
- Potential for higher returns: Active trading can lead to higher returns if the investor can consistently identify profitable opportunities.
- Flexibility: Active traders can quickly adapt to changing market conditions, protecting their portfolios from losses or seizing new opportunities.
단점:
- Higher transaction costs: Frequent trading leads to higher fees and taxes, which can erode potential profits.
- Time-consuming: Active trading requires constant monitoring of the market and investment research.
- Increased risk: Active traders face the risk of making poor decisions due to market timing errors or emotional biases.
예: Imagine two investors, Alice and Bob, each with $10,000 to invest. Alice adopts a buy and hold strategy, while Bob opts for active trading. Over a 20-year period, if Alice earns an average annual return of 7%, her investment would grow to $38,697. If Bob achieves the same 7% annual return, but incurs an additional 1% in fees and taxes due to active trading, his investment would only grow to $32,071.
21.3 Dollar Cost Averaging Strategy
Dollar cost averaging (DCA) is an investment strategy where an investor invests a fixed amount of money at regular intervals, regardless of market conditions. The goal of DCA is to reduce the impact of market volatility and avoid the risk of trying to time the market.
장점:
- Reduces market timing risk: DCA eliminates the need to predict the best time to invest, reducing the risk of poor market timing decisions.
- Disciplined investing: DCA encourages regular, disciplined investing, helping investors build wealth over time.
- Easier budgeting: By investing a fixed amount, investors can easily incorporate DCA into their budget.
단점:
- Potential for lower returns: If the market is consistently rising, DCA may result in lower returns compared to lump-sum investing.
- Not suitable for lump-sum investments: DCA is designed for regular investments and may not be appropriate for investors with a large sum to invest at once.
예: Assume an investor decides to invest $1,000 per month in an index fund for 12 months. During this period, the fund’s price fluctuates, with the investor buying more shares when the price is low and fewer shares when the price is high. By the end of the 12 months, the investor has purchased a total of $12,000 worth of shares at an average cost that is lower than the average market price over the same period. This reduces the impact of market volatility on the investor’s portfolio and helps them accumulate more shares at a lower average cost.
Numerical Example:
Let’s assume an investor invests $500 per month in an index fund for six months. The fund’s share price is as follows:
Month 1: $10
Month 2: $8
Month 3: $12
Month 4: $9
Month 5: $11
Month 6: $10
By following the DCA strategy, the investor buys the following number of shares each month:
Month 1: 50 shares
Month 2: 62.5 shares
Month 3: 41.67 shares
Month 4: 55.56 shares
Month 5: 45.45 shares
Month 6: 50 shares
Total shares purchased: 305.18 shares
Total investment: $3,000
Average cost per share: $9.83
Using DCA, the investor has accumulated 305.18 shares with an average cost per share of $9.83. This is lower than the average market price of $10 over the six-month period. By using DCA, the investor has reduced the risk of poor market timing decisions and smoothed out the impact of market volatility on their investment.
In summary, both buy & hold and active trading strategies have their advantages and drawbacks. Investors should carefully consider their financial goals, risk tolerance, and time commitment before choosing a strategy. Dollar cost averaging is an effective method for reducing market timing risk and accumulating shares at a lower average cost, making it an attractive option for many long-term investors.
주요 수업 정보:
마무리 진술: Technical analysis is a vital tool for stock investors, offering insights into market trends and potential price movements. Mastering these key concepts will enhance your ability to make informed trading decisions.
- Price Charts serve as the foundation of technical analysis, providing visual representation of historical price and volume data, essential for identifying trends and patterns.
- The use of 추세선 in charts helps in pinpointing the direction of stock prices and potential areas of buying and selling pressure.
- Support and Resistance levels on charts indicate where price movements are likely to pause or reverse, guiding traders in their buy or sell decisions.
- Moving Averages are powerful indicators for spotting trends, with SMA and EMA being the most commonly used types in market analysis.
- Technical Indicators like RSI and MACD are valuable tools for traders to gauge market conditions and potential entry or exit points.
- Recognizing Chart Patterns like head and shoulders or triangles can provide advanced warning of potential trend changes, aiding in timely trading decisions.
- 옳은 선택 Timeframe for analysis is crucial, depending on whether you’re a short-term trader or a long-term investor.