
Konjunktur og makroøkonomi
Viktige læringsmål:
Introduksjon: This section elucidates the business cycle, the influence of macroeconomic indicators on the stock market, and the impact of monetary and fiscal policies on the economy. Grasping these concepts is integral for making well-informed investment decisions amid changing economic conditions.
- Understand the Concept of the Business Cycle: Learn about the business cycle and its various phases.
- Grasp the Significance of Macroeconomic Indicators: Understand how macroeconomic indicators influence the stock market and industry performance.
- Comprehend Macroeconomic Terms: Learn how different macroeconomic terms can influence the stock market, sectors, and industries.
- Recognize the Importance of the Business Cycle: Understand the significance of the business cycle in making informed investment decisions.
- Learn the Impacts of Monetary and Fiscal Policies: Understand the differences and impacts of monetary and fiscal policies on the economy.

Figur: A professional using a computer to complete an individual income tax return form online. The image highlights the modern approach to tax filing and the convenience of digital tax return submissions.
Introduksjon
In this section, we’ll introduce the concept of the business cycle and its various phases. We’ll also explore the importance of macroeconomic indicators in understanding the stock market and the performance of different sectors and industries. By the end of this section, you’ll have a solid grasp of these concepts, enabling you to make more informed investment decisions.
4.1 Macroeconomic Factors and the Business Cycle
In this chapter, we’ll introduce you to the fascinating world of macroeconomics and its impact on the stock market. You’ll learn about key macroeconomic terms, indicators, and policies, as well as how they can affect different sectors and industries. We’ll also explore the business cycle and its various phases.
4.2. Ten Essential Macroeconomic Terms
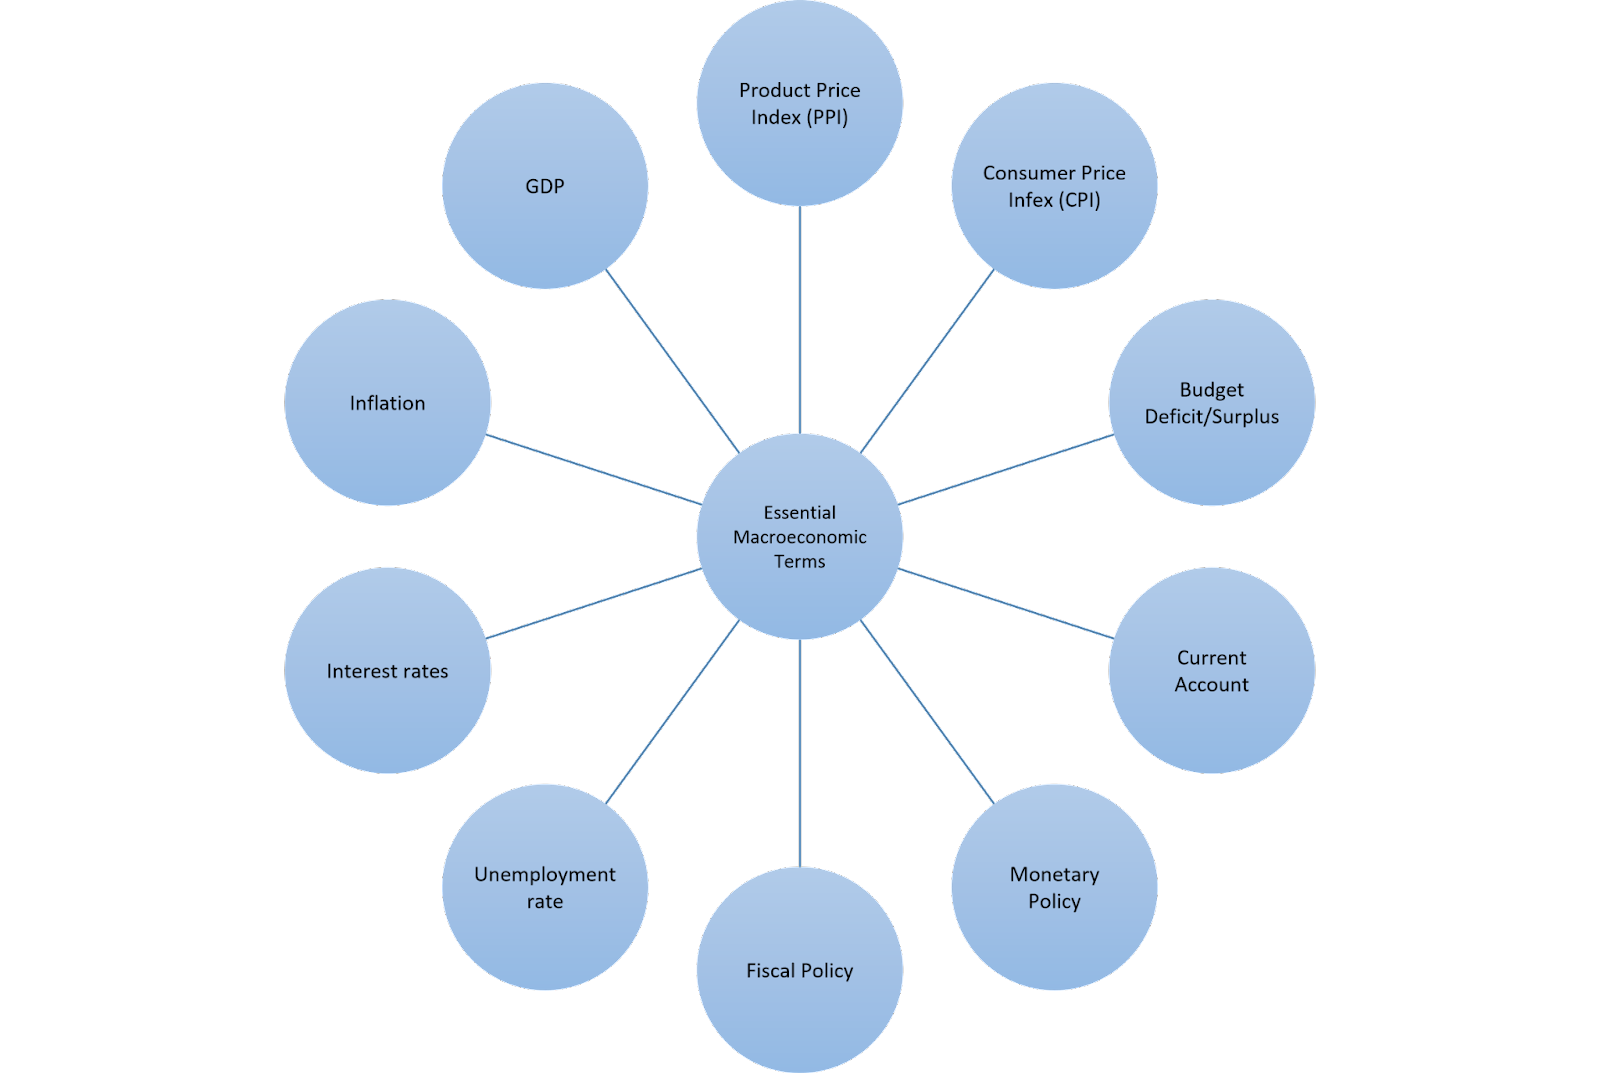
Figurtittel: Comparing Key Macroeconomic Indicators
Kilde: Tilpasset infografikk
Beskrivelse: The figure presents ten essential macroeconomic terms that are fundamental to understanding economic policy and market performance. These include the Product Price Index (PPI), which tracks the average change over time in the selling prices received by domestic producers for their output, and the Consumer Price Index (CPI), which measures changes in the price level of a weighted average market basket of consumer goods and services purchased by households. The Budget deficit/surplus indicates the financial health of a government, with a deficit meaning expenditures exceed revenue. The current account reflects a country’s balance of trade, net earnings on cross-border investments, and direct payments. Monetary policy and fiscal policy represent the actions of a central bank and government to influence the economy through interest rates and taxation, respectively. The unemployment rate measures the number of people actively looking for a job as a percentage of the labor force. Interest rates, controlled by the central bank, affect borrowing costs and economic activity. Inflation represents the rate at which the general level of prices for goods and services is rising. Lastly, the Gross Domestic Product (GDP) is the broadest quantitative measure of a nation’s total economic activity.
Viktige konklusjoner:
- Product Price Index (PPI) og Consumer Price Index (CPI) are indicators of price changes in the economy, affecting consumer purchasing power and business profits.
- Budget deficit/surplus og current account reflect a nation’s economic standing and its international financial strength.
- Monetary policy og fiscal policy are tools used by governments to steer economic growth and stabilize the economy.
- The unemployment rate is a key indicator of labor market health, while interest rates influence investment and consumption.
- Inflation rates are crucial for maintaining a balance between economic growth and cost of living.
- GDP is a primary indicator of a country’s economic performance and growth potential.
Søknad: Understanding these macroeconomic terms is crucial for investors and students of finance as they provide a snapshot of economic health and market conditions. Investors can use this data to make informed decisions about where to allocate their resources, anticipating market movements and potential returns. For example, a rising CPI may signal impending interest rate hikes, which could affect stock and bond markets. A country with a consistent budget surplus and a strong current account might be seen as a safer investment. Recognizing the interplay between monetary policy, fiscal policy, og GDP growth can guide investment timing and strategy. These indicators are also vital for understanding government policy impacts on the economy and personal finances, making them essential knowledge for anyone looking to invest or work in finance.
Here are ten crucial macroeconomic terms you should know:
- Gross Domestic Product (GDP): The total value of goods and services produced within a country during a specific period. It’s a key indicator of economic growth and health. For example, a high GDP growth rate can indicate a strong economy, while a negative GDP growth rate can signal a recession.
- Inflation: The rate at which the general price level of goods and services in an economy increases over time. Inflation erodes the purchasing power of money, making it an essential factor for investors to consider. Central banks often target a specific inflation rate to ensure price stability.
- Interest Rates: The cost of borrowing money, typically expressed as a percentage of the principal amount. Central banks set benchmark interest rates, which impact borrowing costs for businesses and consumers. Higher interest rates can slow economic growth, while lower interest rates can stimulate it.
- Unemployment Rate: The percentage of the labor force that is unemployed but actively seeking work. A low unemployment rate signifies a healthy labor market, while a high unemployment rate can indicate economic weakness.
- Fiscal Policy: Government decisions regarding taxation, spending, and borrowing influence the economy. For example, expansionary fiscal policy (lower taxes and higher government spending) can stimulate economic growth, while contractionary fiscal policy (higher taxes and reduced government spending) can curb inflation.
- Monetary Policy: Central banks’ actions to control the money supply and interest rates in the economy. Expansionary monetary policy (lower interest rates and increased money supply) can promote economic growth, while contractionary monetary policy (higher interest rates and decreased money supply) can fight inflation.
- Current Account: The difference between a country’s exports and imports of goods, services, and transfers. A current account surplus indicates that a country exports more than it imports, while a deficit means it imports more than it exports.
- Budget Deficit/Surplus: The difference between government revenues (mainly from taxes) and expenditures. A budget deficit occurs when expenditures exceed revenues, while a surplus occurs when revenues are higher than expenditures.
- Consumer Price Index (CPI): A measure of the average change in prices paid by consumers for a basket of goods and services over time. It’s a widely used indicator of inflation.
- Producer Price Index (PPI): A measure of the average change in prices received by domestic producers for their output. It’s an important indicator of inflationary pressures in the economy.
4.3. Comparing Two Countries Using Macroeconomic Terms
Let’s compare the United States and Japan using some of these macroeconomic terms:
- GDP Growth Rate: In 2020, the United States experienced a GDP growth rate of -3.5%, while Japan’s GDP growth rate was -4.7%. This indicates that both countries experienced economic contractions, with Japan’s economy shrinking more than the United States.
- Inflation Rate: In 2020, the United States had an inflation rate of 1.2%, while Japan’s inflation rate was -0.1%. This indicates that the United States experienced modest inflation, while Japan experienced slight deflation.
- Unemployment Rate: In 2020, the United States had an unemployment rate of 8.1%, while Japan’s unemployment rate was 2.8%. This suggests that the labor market in Japan was healthier than in the United States, with a lower percentage of the labor force unemployed.
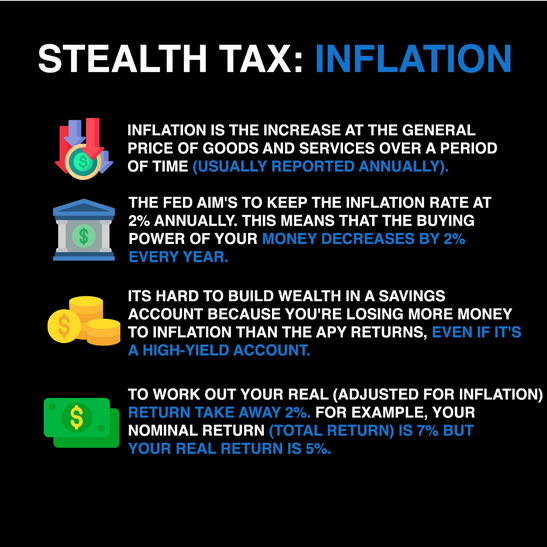
Figur: The infographic delves into the concept of “Stealth Tax: Inflation.” It defines inflation as the increase in the general price of goods and services over time, typically reported annually. The Federal Reserve aims to maintain an inflation rate of 2% annually, implying that the purchasing power of money diminishes by 2% each year. The graphic also highlights the challenge of building wealth in a savings account due to inflation outpacing APY returns. It provides a formula to calculate the real return by subtracting the inflation rate from the nominal return.
Kilde: Tilpasset infografikk
4.4. Macroeconomic Terms and Their Impact on Sectors and Industries
Macroeconomic factors can have significant effects on various sectors and industries. For example:
- Interest Rates: Higher interest rates can negatively impact sectors that rely heavily on borrowing, such as real estate and construction. Conversely, financial companies, like banks, may benefit from higher interest rates as they can charge more on loans.
- Inflation: High inflation can erode consumers’ purchasing power, leading to reduced demand for discretionary goods and services. This can hurt sectors like retail and consumer goods. However, companies in sectors with pricing power, such as utilities, may fare better during periods of high inflation.
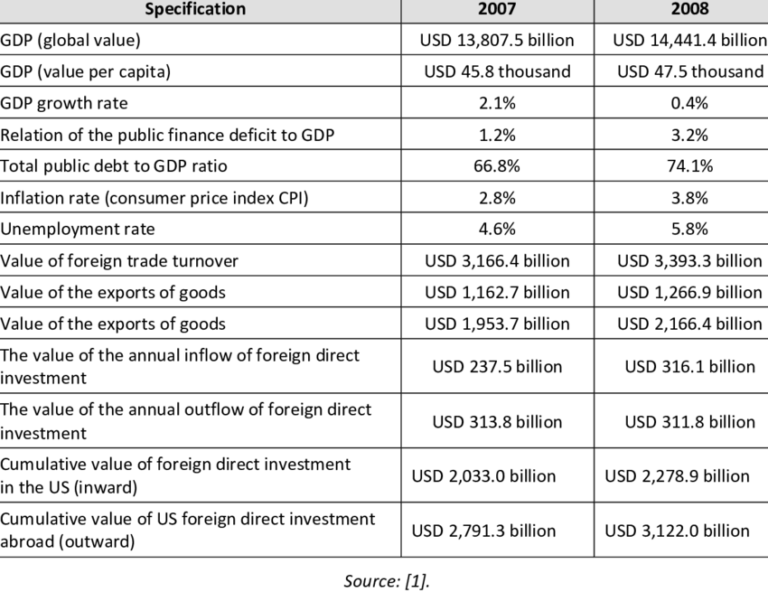
Figurtittel: Main Macroeconomic Indicators of the U.S. Economy: Pre and During the 2007/2008 Financial Crisis
Source: ResearchGate URL:
Beskrivelse: The table offers a comprehensive view of the principal macroeconomic metrics of the U.S. economy, drawing a stark contrast between the pre-crisis values of 2007 and the turmoil-infused ones of 2008. This side-by-side comparison underscores the drastic shifts and repercussions of the financial meltdown on a macroeconomic level.
Viktige konklusjoner:
- Economic Slowdown: The macroeconomic figures from 2008 reflect the considerable economic stagnation following the financial meltdown. Most indicators display a decline or a negative trend in comparison to 2007.
- Consumer Behavior: Consumer spending, a pivotal driver of the U.S. economy, likely decreased in 2008, as reflected by potential drops in consumer confidence and purchasing power.
- Investment & Employment: The financial uncertainty probably led to reduced investments by businesses and increased unemployment rates, pointing towards a contractionary phase in the business cycle.
- Credit Crunch: Financial institutions became more wary, potentially leading to reduced lending, making capital access challenging for businesses and individuals alike.
Søknad: Understanding the tumultuous changes in the macroeconomic indicators during crises, like that of 2007/2008, is pivotal for investors and policymakers. It gives investors a sense of market trends and potential risks, assisting in better decision-making. For policymakers, such insights are crucial in framing responsive strategies to stabilize the economy and lay foundations for recovery. The 2007/2008 crisis serves as a potent reminder of the interwoven nature of global economies and the domino effect that a financial meltdown in one major economy can have worldwide.
4.5. Top 10 Economic Indicators
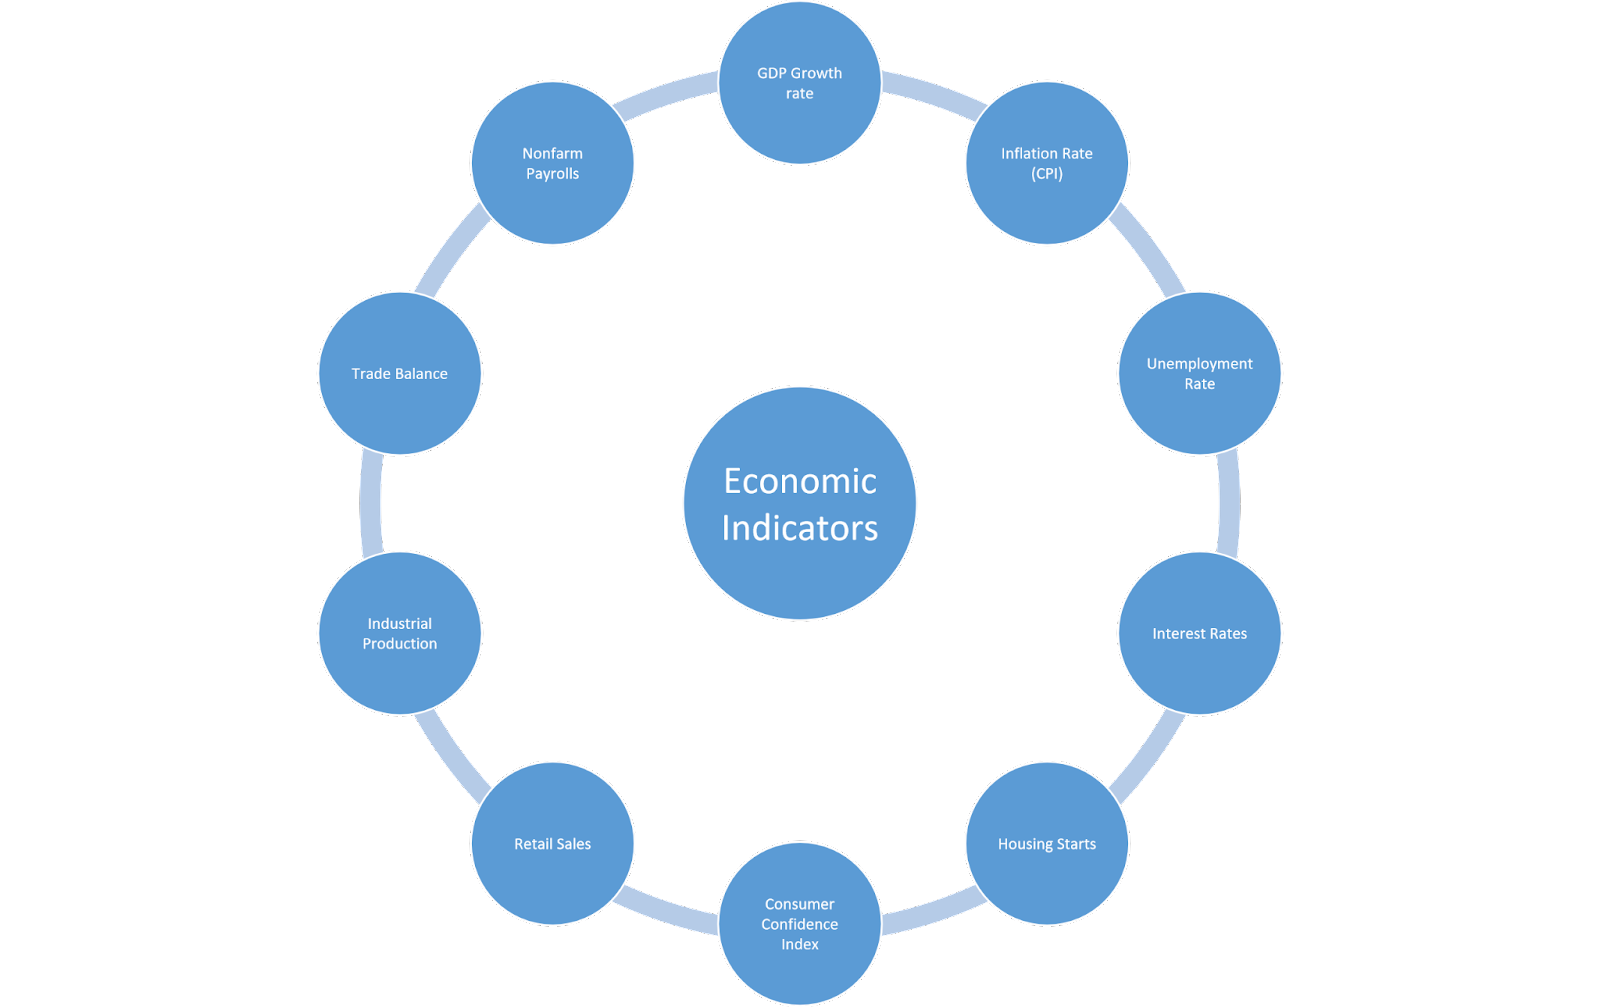
Figurtittel: Overview of Principal Economic Indicators
Kilde: Tilpasset infografikk
Beskrivelse: The figure illustrates a comprehensive set of principal economic indicators that are pivotal in assessing the health and direction of an economy. The GDP growth rate measures the rate of expansion or contraction of an economy’s output. The inflation rate (CPI) gauges the average change in prices paid by consumers over time. The unemployment rate reflects the percentage of the labor force that is jobless and actively seeking employment. Interest rates are set by the central bank and influence the cost of borrowing and spending. Housing starts indicate the number of new residential construction projects begun during a particular period and are a leading indicator for the housing market. The Consumer Confidence Index measures the degree of optimism that consumers feel about the overall state of the economy and their personal financial situation. Retail sales track consumer spending at retail establishments, reflecting the demand for goods and services. Industrial production measures the output of the industrial sector, including manufacturing, mining, and utilities. The trade balance shows the difference between the value of a country’s imports and exports. Lastly, nonfarm payrolls represent the total number of paid U.S. workers of any business, excluding farm employees, government employees, private household employees, and employees of nonprofit organizations.
Viktige konklusjoner:
- The GDP growth rate is a broad measure of economic activity and health.
- Inflation rate (CPI) og interest rates are closely watched for monetary policy implications.
- The unemployment rate is a lagging indicator that reflects the employment health of the economy.
- Housing starts can predict future construction activity and related economic factors.
- The Consumer Confidence Index og retail sales data provide insight into consumer spending behavior.
- Industrial production is a leading indicator of industrial sector performance.
- Trade balance figures help assess a country’s economic competitiveness.
- Nonfarm payrolls are a key indicator of job growth and labor market trends.
Søknad: These economic indicators are essential for investors, policymakers, and economists as they provide valuable insights into the economy’s performance and future direction. Investors can use these indicators to make strategic decisions, such as investing in sectors that benefit from low interest rates or strong GDP growth. Understanding the unemployment rate og consumer confidence can help predict consumer spending patterns, which in turn can influence stock market trends. Monitoring housing starts og retail sales can provide early signals of economic expansion or contraction. For those learning about investing, grasping these indicators is crucial for developing a macroeconomic perspective that informs sound investment choices and risk management.
Here are ten essential economic indicators:
- GDP Growth Rate: Indicates the pace of economic growth and overall health of the economy.
- Inflation Rate (CPI): Reflects the average change in consumer prices and is a widely used measure of inflation.
- Unemployment Rate: Provides insight into the health of the labor market and overall economy.
- Interest Rates: Set by central banks, they affect borrowing costs for businesses and consumers and influence overall economic growth.
- Housing Starts: Measures the number of new residential construction projects and is an indicator of the health of the housing market.
- Consumer Confidence Index: Reflects consumers’ optimism or pessimism about the economy and their personal financial situations.
- Retail Sales: This represents the total sales of goods and services in the retail sector, providing insight into consumer spending patterns.
- Industrial Production: Measures the output of factories, mines, and utilities, providing insight into the health of the manufacturing sector.
- Trade Balance: The difference between a country’s imports and exports, indicating its competitiveness and reliance on foreign markets.
- Nonfarm Payrolls: Measures the change in the number of employed people, excluding the agricultural sector, and is a key indicator of labor market health.
4.6. Monetary and Fiscal Policy
Monetary policy involves central banks’ actions to control the money supply and interest rates in an economy.
Examples include:
- Lowering interest rates to stimulate borrowing and spending.
- Implementing quantitative easing (QE), which involves central banks purchasing government bonds to increase the money supply and lower long-term interest rates.
- Raising interest rates to combat inflation.
- Selling government bonds to reduce the money supply and increase interest rates.
Fiscal policy involves government decisions regarding taxation, spending, and borrowing to influence the economy.
Examples include:
- Cutting taxes to boost consumer spending and business investment.
- Increasing government spending on infrastructure projects to stimulate economic growth.
- Raising taxes to curb inflation and reduce budget deficits.
- Reducing government spending to control inflation and decrease public debt.
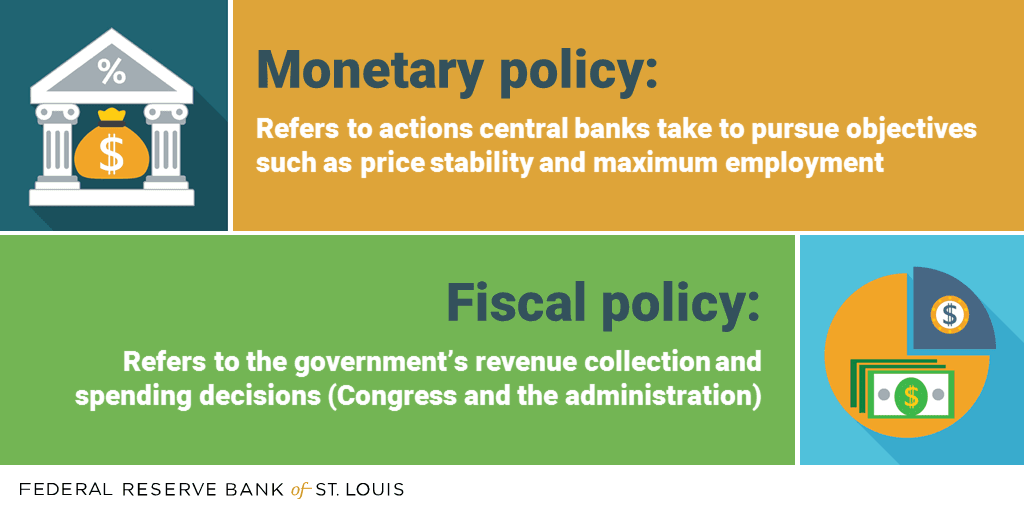
Figure title: Differences between Fiscal and Monetary Policy
Kilde: Federal Reserve Bank of St. Louis
Beskrivelse: The image from the Federal Reserve Bank of St. Louis elucidates the distinctions between fiscal and monetary policy. Fiscal policy pertains to the tax and spending decisions of the federal government, often associated with the size of the government budget deficit. On the other hand, monetary policy is the domain of central banks, like the Federal Reserve in the U.S., and involves actions to achieve macroeconomic objectives such as price stability and maximum employment. The article further illustrates how both policies were employed in response to the 2007-2009 financial crisis.
Viktige konklusjoner:
- Monetary Policy: Managed by central banks, it deals with actions related to money supply and interest rates to achieve macroeconomic objectives.
- Fiscal Policy: Managed by the federal government, it involves tax and spending decisions, often gauged by the size of the government’s budget deficit.
- Tools of Monetary Policy: Include open market operations, the discount rate, reserve requirements, and interest on reserve balances.
- Response to Financial Crisis: Both monetary and fiscal policies were employed to mitigate the effects of the 2007-2009 financial crisis, with the Federal Reserve using tools like open market operations and the U.S. government enacting various programs to stimulate the economy.
Søknad: Understanding the distinction between fiscal and monetary policy is crucial for investors and students of finance. While both can influence the economy, they operate through different mechanisms and are managed by different entities. Recognizing how these policies are employed in real-world scenarios, such as during economic downturns, can offer insights into the broader economic strategies of governments and central banks.
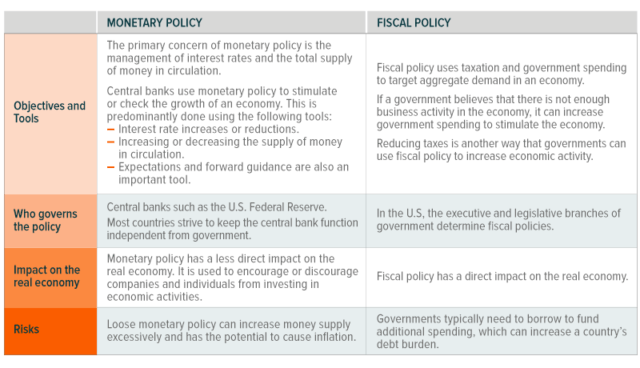
Figure title: Monetary vs. Fiscal Policy: A Comparative Analysis
Kilde: GlobalETFs:
Beskrivelse: This figure provides a side-by-side comparison of monetary and fiscal policy, shedding light on their respective objectives, tools, governing bodies, real-world impacts, and associated risks. By contrasting these two economic policies, the table offers a concise overview of their roles and implications in the economy.
Viktige konklusjoner:
- Monetary and fiscal policies have distinct objectives and tools.
- Different bodies govern these policies: central banks for monetary and government bodies for fiscal.
- Both policies have tangible impacts on the real economy, influencing factors like employment, inflation, and overall economic growth.
- Each policy comes with its own set of risks, which can have significant consequences if not managed properly.
Søknad: Understanding the difference between monetary and fiscal policy is crucial for investors. It helps them anticipate potential market movements based on policy changes, thereby informing investment strategies. Moreover, a grasp of these concepts allows one to better comprehend economic news and its implications on the financial markets.
4.7. Business Cycle Phases and Macroeconomic Indicators
The business cycle has four main phases: expansion, peak, contraction, and trough. Here’s how to identify each phase using macroeconomic indicators:
- Expansion: Characterized by increasing GDP growth, low unemployment, and moderate inflation. Macroeconomic indicators like retail sales, industrial production, and housing starts are generally rising.
- Peak: The point at which GDP growth reaches its highest level before starting to decline. Unemployment is typically low, and inflation may be increasing rapidly.
- Contraction: Marked by decreasing GDP growth, rising unemployment, and slowing inflation. Macroeconomic indicators like retail sales, industrial production, and housing starts may be falling.
- Trough: The point at which GDP growth reaches its lowest level before starting to rise again. Unemployment is typically high, and inflation may be low or negative (deflation). Macroeconomic indicators like retail sales, industrial production, and housing starts are generally weak or stabilizing.
Understanding these phases and their characteristics can help investors make informed decisions about their portfolios. For example, during an expansion, investors may want to focus on cyclical sectors, such as technology and consumer discretionary, which tend to perform well when the economy is growing. Conversely, during a contraction, investors may want to shift towards defensive sectors, like utilities and consumer staples, which are less sensitive to economic fluctuations.
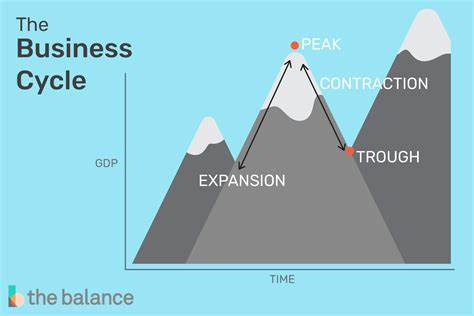
Figure title: The Business Cycle: Understanding Economic Fluctuations
Kilde: The Balance
Beskrivelse: The business cycle represents the fluctuations in economic activity over time, encompassing four major phases: expansion, peak, contraction, and trough. These phases are influenced by various factors, including supply and demand forces, capital availability, and consumer and investor confidence. The cycle is not regular in its intervals or durations, but its phases have recognizable indicators. The National Bureau of Economic Research (NBER) uses various metrics, including GDP growth rates, to determine the current phase of the economy.
Viktige konklusjoner:
- Expansion: This phase is characterized by increased production, hiring, and growth. GDP growth rate is positive, and a rate of around 2% is considered healthy.
- Peak: The economy reaches its highest point before heading into contraction. GDP growth rate starts to decline.
- Contraction: Economic activity shrinks, leading to layoffs and reduced spending. A negative GDP growth rate indicates a recession.
- Trough: The lowest point in the cycle, after which the economy starts transitioning back to the expansion phase.
Influences on the Business Cycle: The government and the Federal Reserve play significant roles in influencing the cycle through fiscal and monetary policies, respectively.
Søknad: Understanding the business cycle is crucial for investors as it provides insights into potential economic downturns or upswings. By recognizing the signs of each phase, investors can make informed decisions about when to buy or sell assets. For instance, during the expansion phase, stock prices typically rise, making it a favorable time for investment. Conversely, during contraction, investors might consider more conservative investment strategies. Recognizing these patterns can help in optimizing returns and mitigating risks.
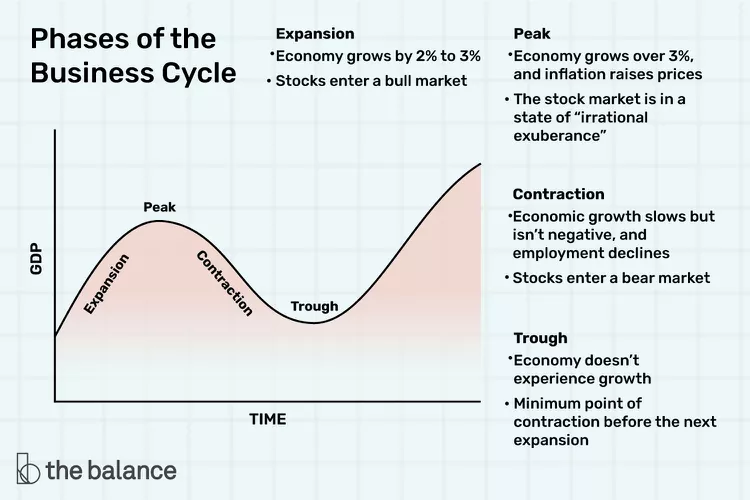
Figurtittel: Phases of the Business Cycle
Kilde: TheBalanceMoney
Beskrivelse: The figure illustrates the various phases of a business cycle using GDP as a measurement of economic output. Over time, economies naturally go through growth (expansion) and decline (contraction) phases, with the highest and lowest points being termed the peak and trough, respectively.
Viktige konklusjoner:
- The business cycle is composed of four main phases: expansion, peak, contraction, and trough.
- GDP serves as an indicator for these cycles, with rises indicating growth and falls indicating economic decline.
- Peaks represent the zenith of economic activity in one cycle, whereas troughs symbolize the lowest point.
Søknad: Understanding the phases of a business cycle is pivotal for investors. It offers insights into when to invest or divest in certain markets. Recognizing these phases can aid in making informed investment decisions based on market trends.
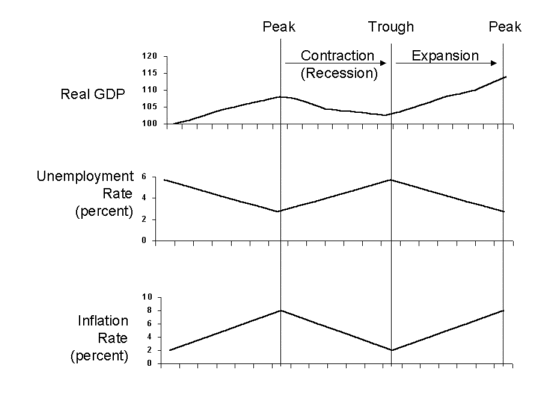
Figurtittel: Business Cycle Impacts on Real GDP, Unemployment, and Inflation Rates
Kilde: Lidderdale
Beskrivelse: The figure displays three interconnected graphs representing Real GDP, Unemployment Rate, and the Inflation Rate throughout various stages of the business cycle. These stages include the peak, contraction (recession), trough, and expansion. Each stage has distinct effects on these economic indicators.
Viktige konklusjoner:
- At the peak of the business cycle, Real GDP is at its highest, Unemployment Rate is typically low, and the Inflation Rate is high.
- During contraction or recession, Real GDP decreases due to less economic activity, the Unemployment Rate increases, and Inflation Rate decreases due to diminished spending.
- The trough represents the lowest point in the business cycle, after which economic revival starts.
- Expansion follows the trough, marking the start of a new business cycle, and during this phase, economic indicators begin to improve.
Søknad: Understanding these relationships helps investors anticipate potential changes in economic conditions based on the current stage of the business cycle. This awareness can aid in making informed decisions on when to invest, hold, or divest from certain assets, ensuring a more strategic approach to market trends.
Konklusjon:
- Macroeconomic factors play a significant role in the stock market and can impact various sectors and industries.
- Understanding and monitoring key macroeconomic terms, indicators, and policies can help investors make better-informed investment decisions.
- The business cycle consists of four main phases: expansion, peak, contraction, and trough. Recognizing these phases and their characteristics can provide valuable insights for investors.
- By learning about macroeconomics and its relationship with the stock market, you’ll gain valuable knowledge that can help you navigate the complexities of investing. Keep exploring, stay curious, and enjoy the journey!
Viktige takeaways:
Avsluttende uttalelse: An understanding of the business cycle, macroeconomic indicators, and governmental policies is indispensable for anticipating market trends and making prudent investment decisions. This section imparts essential knowledge to navigate the economic aspects of investing.
- Macroeconomic factors are pivotal in determining the performance of the stock market, affecting different sectors and industries.
- To make informed investment decisions, it’s crucial to understand and monitor macroeconomic terms, indicators, og policies.
- The business cycle encompasses four main phases: expansion, peak, contraction, og trough. Recognizing these phases can offer valuable insights for investment strategies.
- Macroeconomic knowledge, especially in its relationship with the stock market, is invaluable for navigating the intricacies of investing.
- Different macroeconomic terms and indicators, such as interest rates og inflation, can have distinct impacts on various sectors and industries.