
Capítulo 5: Análise de Tendências
Objetivos de aprendizagem da lição:
Introdução: This chapter delves into the pivotal concepts of Trend Analysis and Price Patterns, emphasizing the importance of Multiple Timeframe Analysis in technical trading. By mastering the mechanics behind trendlines, channels, and the interpretation of various price patterns, you are equipped to discern market directions and predict future movements with greater accuracy. These tools are instrumental across all trading styles, enhancing your ability to identify lucrative opportunities and make informed decisions based on historical and current market behavior. The integration of these concepts provides a solid foundation for refining trading strategies and navigating market complexities with confidence.
- Grasp the Concept of Market Trends: Learn to identify uptrends, downtrends, and sideways trends to make informed trading decisions.
- Master the Art of Drawing Trendlines and Navigating Channels: Accurately apply these tools to identify market trends, potential reversals, and strategic entry and exit points.
- Decode Market Signals with Price Patterns: Understand the significance of reversal and continuation patterns for anticipating market movements.
- Harness the Power of Multiple Timeframe Analysis: Employ this strategy to enhance the robustness of your market analysis and trading decisions.

Figura: A stock photo illustrating the concept of trends in technology. This image captures the essence of modern technological advancements and their impact on current trends, symbolizing the intersection of innovation and everyday life.
Fonte: Shutterstock
Introdução
In this chapter, we delve deeper into one of the fundamental concepts in technical analysis: trends. Identifying the direction of a trend is crucial in trading, whether you’re a day trader, swing trader, or trend trader. We’ll explore different types of trends, learn how to draw trendlines and channels, discuss common price patterns, and emphasize the importance of multiple timeframe analysis.
Part 1: Trendlines in Trading

Figura: A vector illustration of a business chart showing both upward and downward trends, typically used in foreign exchange or stock market analysis. This image effectively represents the fluctuations and dynamics of financial markets, highlighting the concepts of growth and decline in economic contexts.
Fonte: Shutterstock
Trends refer to the general direction in which the market is moving. There are three main types of trends:
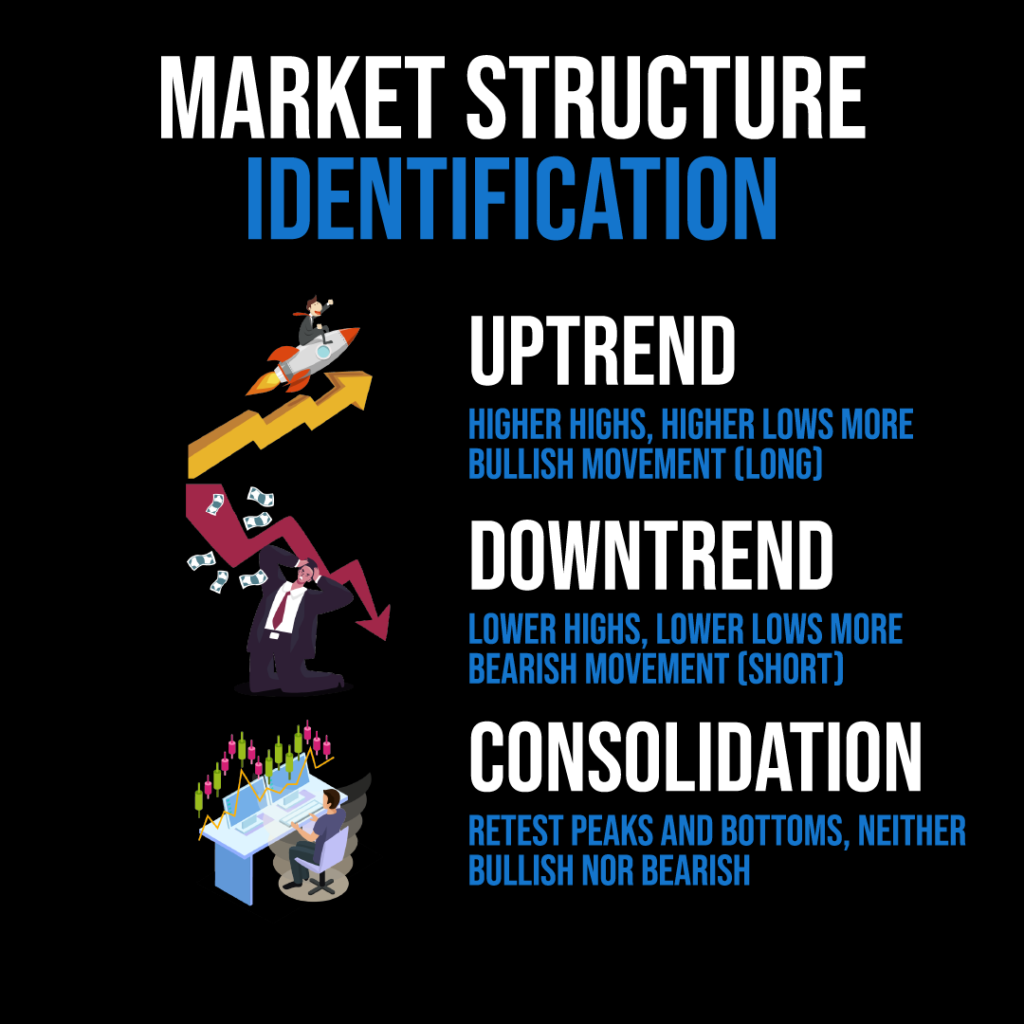
Figure: Market Structure Identification
Fonte: Infográfico personalizado
Descrição: This infographic explains the basic structures of market trends: Uptrend, Downtrend, and Consolidation. An ‘Uptrend’ is identified by higher highs and higher lows, indicating bullish movement, suitable for long positions. A ‘Downtrend’ is marked by lower highs and lower lows, signaling bearish movement, appropriate for short positions. ‘Consolidation’ is characterized by retesting peaks and bottoms without a clear bullish or bearish direction. Understanding these market structures is essential for traders to make informed decisions about when to enter or exit trades, and which direction to trade in.
Uptrend: Characterized by higher highs and higher lows, it’s a period when bulls (buyers) control the market.
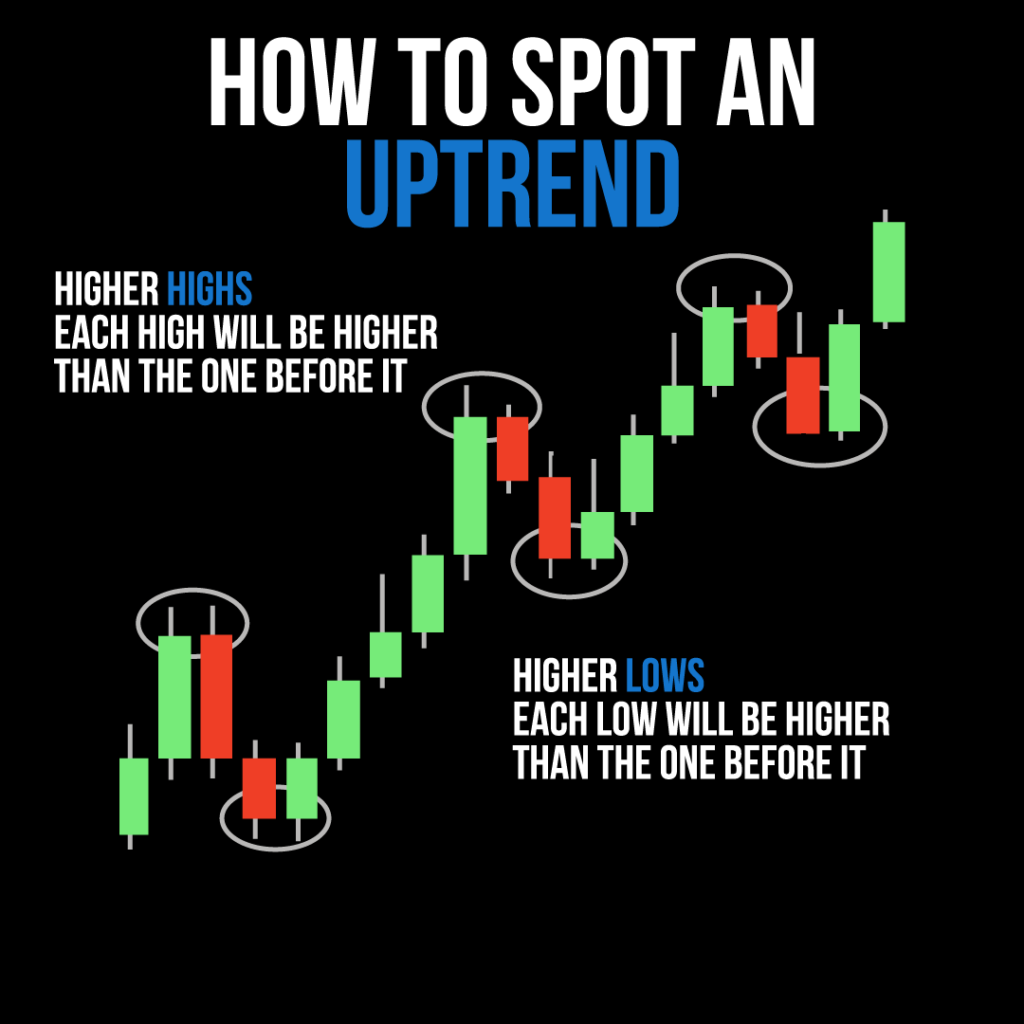
Figure: Identifying an Uptrend in Market Charts
Descrição: This infographic provides a clear guide on how to spot an uptrend in financial markets. An uptrend is characterized by a series of ‘Higher Highs’ and ‘Higher Lows.’ This means each successive peak (high) is higher than the one before, and each low point is also higher than the previous low. This pattern indicates a continuous upward movement in the price, reflecting a bullish market sentiment. For traders and investors, recognizing an uptrend is crucial as it often suggests a favorable time to consider long positions or buy trades.
Fonte: Infográfico personalizado
Downtrend: Characterized by lower highs and lower lows, it indicates that bears (sellers) have taken control.
Sideways trend (Range-bound): The market isn’t making clear higher highs or lower lows; instead, it’s moving sideways.
Real-world chart examples will be provided to help you identify these trends visually.

Figure: A businessman’s hand controlling a trendline and volume chart, symbolizing active engagement and analysis in the stock market.
Fonte: Shutterstock
Introduction to Trendlines
In the world of trading, trendlines are akin to navigational routes on a chart. These simple yet powerful tools are instrumental in revealing the market’s direction and sentiment. By effectively using trendlines, traders can anticipate future price movements, identify reversal points, and enhance their trading strategies.
A. The Foundation of Trendlines
Definição: Trendlines are straight lines drawn on a price chart that connect a series of prices. They help to visualize the direction of the market movement.
Types of Trendlines:
- Upward Trendlines: Drawn by connecting higher lows. These indicate an uptrend and act as support levels where buyers are expected to enter.
- Downward Trendlines: Formed by linking lower highs. These signify a downtrend and serve as resistance levels where sellers might emerge.
B. Drawing Trendlines: Best Practices
Identification of Points: Select at least two significant low points for upward trendlines or high points for downward trendlines. The more points connected, the stronger the trendline.
Angle and Slope: The slope of a trendline can indicate the strength of the trend. Steeper trendlines may represent stronger, but potentially less sustainable trends.
Validation: A trendline is validated when the price touches and bounces off it. Repeated validations strengthen the reliability of the trendline.
C. Using Trendlines in Trading Strategies
- Entry Signals: Consider buying when the price touches and bounces off an upward trendline. Conversely, consider selling or shorting when the price rejects a downward trendline.
- Exit Signals: A break below an upward trendline or above a downward trendline can signal a potential reversal, indicating a possible exit or reversal of position.
- Stop-Loss Placement: For upward trendlines, place stop-losses just below the trendline to protect against a sudden downturn. For downward trendlines, set them just above the trendline.
- Trendline Breakouts: A breakout through a trendline can signal a significant shift in market sentiment. A breakout above a downward trendline may signal a move to bullish conditions, while a break below an upward trendline indicates bearish potential.
D. The Significance of Trendlines
- Simplicity and Effectiveness: Trendlines are straightforward to draw and can be extremely effective in various market conditions and timeframes.
- Versatilidade: Applicable to any traded instrument – stocks, forex, commodities, etc., across different time frames.
- Limitations: Over-reliance on trend lines without confirmation from other indicators or volume can lead to false signals. Trendlines are more of an art than a science and require practice to use effectively.
E. Real-World Examples and Calculations
- Stock Trend Analysis: Illustrate with an example of a stock chart, showing how trendlines are drawn and how they align with actual market moves.
- Calculations for Entry and Exit: Provide numerical examples of setting entry points, exit points, and stop-loss levels based on trendline analysis.
Conclusion: Charting a Path with Trendlines
Trendlines are a fundamental aspect of technical analysis, offering critical insights into market trends and potential reversal points. They provide a simplistic yet effective method for traders to navigate the complexities of market movements. As with any technical tool, the key to success with trendlines lies in consistent practice, patience, and complementing them with other technical indicators for a holistic trading approach.
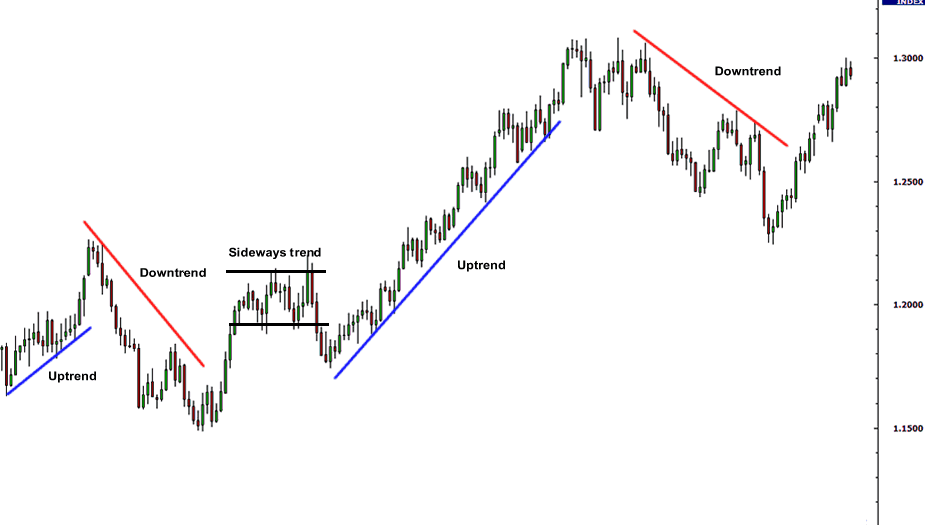
Figure title: Trendlines and Channels in Crypto Trading
Fonte: Crypto Trading Guide
Descrição: The image is likely a graphical representation of trendlines and channels used in cryptocurrency trading. Trendlines are straight lines drawn on a price chart that connect a series of highs or lows, indicating a trend’s direction. An uptrend line connects higher lows, showing support levels, while a downtrend line connects lower highs, indicating resistance levels. Channels are formed by drawing parallel lines to the trendlines, creating a range within which the price moves. The image may show examples of both uptrend and downtrend scenarios, illustrating how these tools are used to identify potential buy or sell signals in the crypto market.
Principais conclusões:
- Linhas de tendência: Useful in identifying the direction of the market trend, whether it’s an uptrend or downtrend.
- Channels: Provide a visual representation of the price range within a trend.
- Apoio e Resistência: Trendlines and channels help in identifying support and resistance levels.
- Trading Signals: These tools can offer insights into potential entry and exit points in crypto trading.
Aplicativo: For cryptocurrency traders, understanding how to draw and interpret trendlines and channels is crucial for technical analysis. These tools help in making informed decisions about when to enter or exit trades, based on the trend’s strength and direction. Trendlines and channels can be applied across various time frames, making them versatile for both short-term and long-term trading strategies. They are particularly useful in the highly volatile crypto market, where identifying trends and potential reversals can significantly impact trading success.
Part 2: Channels in Trading
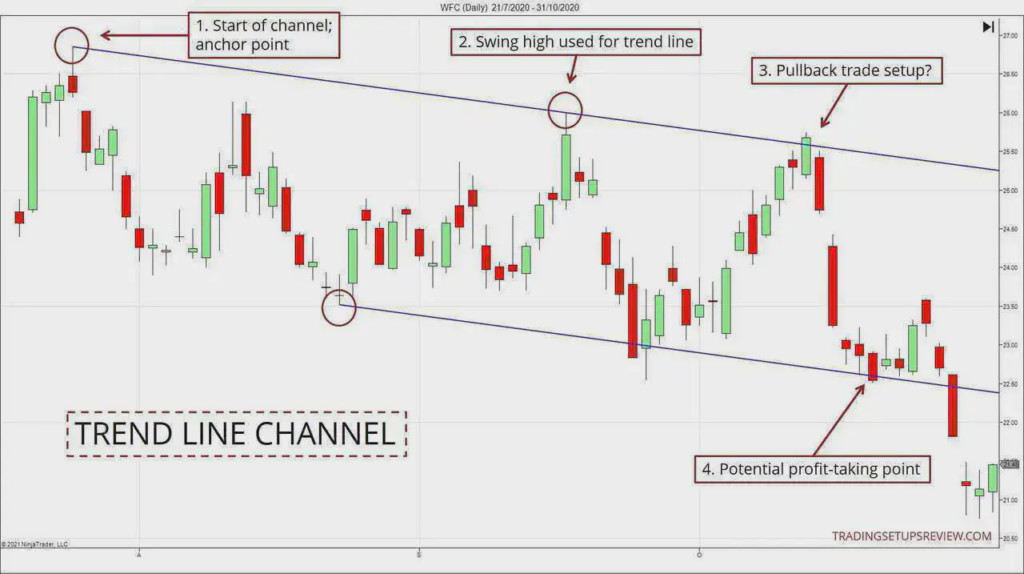
Figure title: Trend Line and Channel Trading Strategy
Fonte: Trading Setups Review
Descrição: The image is likely a detailed illustration of a trend line and channel trading strategy. It probably shows a price chart with trend lines drawn to connect the highs and lows of the price action, forming a channel. This channel helps traders identify potential support and resistance levels within a trend. The image may also highlight key points where the price touches or breaks through these trend lines, indicating possible entry or exit points for trades. Additionally, it could illustrate how the channel’s boundaries can be used to gauge the strength of the trend and make predictions about future price movements.
Principais conclusões:
- Trend Lines: Useful tools for identifying the direction and strength of a market trend.
- Trading Channels: Formed by parallel trend lines, indicating potential support and resistance areas.
- Entry and Exit Points: Points where the price touches or breaks the trend lines can signal trading opportunities.
Market Analysis: Helps in understanding market dynamics and planning trades based on trend continuation or reversal.
Aplicativo: For traders, especially those who rely on technical analysis, understanding how to draw and interpret trend lines and channels is crucial. This strategy can be applied in various markets, including stocks, forex, and commodities. It aids in making informed decisions about when to enter or exit trades, based on the trend’s behavior relative to the channel. This approach is particularly useful for identifying potential reversals or continuations in the price trend, helping traders to capitalize on market movements effectively.
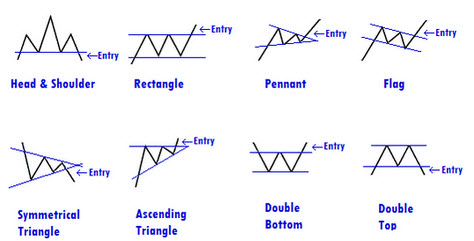
Figure title: Common Chart Patterns in Trading
Fonte: HamiltonFX
Descrição: The image displays common chart patterns used in trading. These patterns are graphical representations of price movements and include formations like Head and Shoulders, Rectangles, Pennants, Flags, Symmetrical Triangles, Ascending Triangles, Double Bottoms, and Double Tops. Each pattern has distinct characteristics and is used by traders to predict future price movements. For example, a Head and Shoulders pattern typically indicates a reversal from a bullish to a bearish trend, while a Double Bottom suggests a potential upward movement after a downtrend.
Principais conclusões:
- Head and Shoulders: Indicates a potential bearish reversal.
- Rectangles: Represents consolidation within a certain price range.
- Pennants and Flags: Short-term continuation patterns.
- Symmetrical and Ascending Triangles: Indicate continuation or reversal based on breakout direction.
- Double Bottom and Top: Suggest reversal patterns at the end of a trend.
Aplicativo: For traders, recognizing these chart patterns is crucial for technical analysis and making informed trading decisions. Each pattern provides insights into potential future price movements, helping traders to identify entry and exit points. Understanding these patterns is particularly useful in volatile markets, where they can signal key trend reversals or continuations. Traders can use this knowledge to develop strategies based on the likelihood of certain price actions following these patterns
Introduction: Charting the Course with Channels
Channels in trading are like well-defined paths within which prices move. They offer traders a structured view of market trends, enabling them to predict potential areas for profitable entry and exit. Understanding how to identify and interpret channels is crucial for navigating the waves of market volatility.
A. Understanding Channels
Definição: A channel is formed by two parallel trendlines that act as boundaries within which the price moves. It consists of an upper line (resistance) and a lower line (support).
- Types of Channels:
- Ascending (Up) Channels: Formed during an uptrend, connecting higher highs and higher lows.
- Descending (Down) Channels: Created during a downtrend, linking lower highs and lower lows.
- Horizontal (Sideways) Channels: Occur in a range-bound market, showing horizontal movement.
- Ascending (Up) Channels: Formed during an uptrend, connecting higher highs and higher lows.
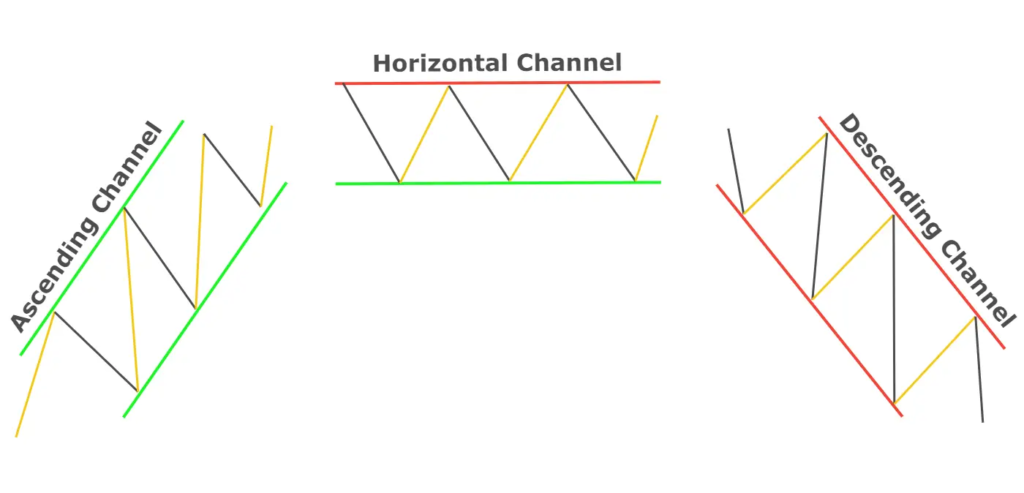
Figure title: Types of Trend Channels in Forex Trading
Fonte: ForexBee
Descrição: The image illustrates various types of trend channels used in Forex trading. Trend channels are graphical tools used to outline the upper and lower boundaries of a currency pair’s price movements. The image likely shows different forms of channels such as ascending, descending, and horizontal channels. An ascending channel indicates an uptrend with higher highs and higher lows, a descending channel represents a downtrend with lower highs and lower lows, and a horizontal channel suggests a range-bound or sideways market. These channels are drawn by connecting the highs and lows of price action with parallel lines.
Principais conclusões:
- Ascending Channel: Indicates an uptrend, useful for identifying buy opportunities.
- Descending Channel: Represents a downtrend, signaling potential sell opportunities.
- Horizontal Channel: Suggests a range-bound market, useful for range trading strategies.
- Price Boundaries: Channels help in identifying potential support and resistance levels.
Aplicativo: For Forex traders, understanding and identifying these channels is crucial for making informed trading decisions. Channels provide a visual representation of the current market trend and can be used to forecast potential future price movements. Traders can use these channels to identify entry and exit points, set stop-loss and take-profit levels, and gauge the strength of a trend. This knowledge is particularly valuable in developing trend-following strategies and managing risk in the volatile Forex market
B. Drawing and Analyzing Channels
- Identification of Points: For ascending channels, connect two or more higher lows to draw the lower trendline, then draw a parallel line at the swing highs. Reverse this for descending channels.
- Trading Within Channels: The upper and lower boundaries of channels are used as indicators for potential buy or sell points.
- Channel Breakouts: A breakout from a channel indicates a strong move. If it’s upwards from an ascending channel, it’s bullish; if downwards, it’s bearish.
C. Channels as Trading Tools
- Entry Strategies: Buy near the lower trendline of ascending channels or sell near the upper trendline of descending channels.
- Exit Strategies: Consider taking profits or closing positions when prices approach the opposite side of the channel.
- Stop-Loss Strategies: Set stop losses outside the channel to protect against potential breakout failures.
D. Practical Applications and Examples
- Real-World Trading Scenario: Illustrate with stock or forex charts showing ascending, descending, and horizontal channels and how they were used in actual trades.
- Numerical Examples: Provide calculations showing how to set entry, exit, and stop-loss points based on channel analysis.
E. Advantages and Limitations
- Clarity in Trend Direction: Channels help in understanding the prevailing market trend, whether it’s upward, downward, or sideways.
- Predictive Power: The boundaries of channels can serve as predictive areas for taking positions and setting targets.
- Limitations: Channels may not always accurately predict breakouts. Sometimes, price breaks through a channel only to revert back into it.
Conclusion: Navigating the Markets with Channels
Channels offer a clear and structured way to analyze market trends and make informed trading decisions. They are an essential tool for traders looking to capitalize on the ebb and flow of price movements. Mastery of channel trading requires practice and an understanding that no single tool provides all answers. It’s essential to use channels in conjunction with other technical indicators for a comprehensive market analysis.
Part 3: Price Patterns in Trading
Introduction: Decoding Market Messages with Price Patterns
Price patterns in trading are like hidden messages in the market’s behavior, waiting to be decoded. They are specific formations created by the movements of security prices on a chart, and recognizing these patterns can provide valuable insights into future market movements. Let’s delve into the world of price patterns and explore how they can be used to enhance trading strategies.
A. The Essence of Price Patterns
- Definição: Price patterns are distinctive formations created by the fluctuation of an asset’s price. They are used by traders to predict the future movement of prices based on historical performance.
- Types of Price Patterns:
- Reversal Patterns: Indicate a potential change in the current trend.
- Continuation Patterns: Suggest that the current trend is likely to continue.
- Reversal Patterns: Indicate a potential change in the current trend.
B. Key Price Patterns and Their Interpretations
- Head and Shoulders: This pattern appears at market tops. The formation consists of a peak (shoulder), followed by a higher peak (head), and another lower peak (shoulder).
- Double Top and Double Bottom: These patterns signal trend reversals. A double top occurs at the end of an uptrend, while a double bottom occurs at the end of a downtrend.
- Rectangles: Often seen as consolidation patterns, rectangles form when prices move between parallel support and resistance lines.
- Pennants and Flags: Short-term continuation patterns that indicate a brief consolidation before the previous trend resumes.
- Symmetrical, Ascending, and Descending Triangles: These patterns are formed by converging trendlines and can indicate either a continuation or a reversal, depending on the breakout direction.
C. Trading Strategies Based on Price Patterns
- Entry and Exit Points: Trades are typically entered following a breakout from the pattern. For instance, a buy order may be placed following the breakout of a resistance level in a double bottom pattern.
- Stop Loss and Take Profit: Stop-loss orders are generally placed just outside the pattern’s boundary. Take-profit levels can be estimated based on the size of the pattern.
- Volume Confirmation: Ideally, breakouts should be accompanied by increased volume, which validates the pattern and its predictive power.
D. Practical Application: Real-World Examples
- Stock Market Scenarios: Illustrate how these patterns have historically played out in the stock market, using real-life chart examples.
- Numerical Illustrations: Provide specific examples, including potential entry points, stop-loss levels, and take-profit targets based on the size and nature of the pattern.
E. Advantages and Challenges
- Predictive Nature: Price patterns can be remarkably accurate in forecasting future price movements.
- Versatilidade: Applicable across various timeframes and in all markets – stocks, forex, commodities.
- Limitations: No pattern is foolproof. External factors and market news can disrupt pattern formations.
Conclusion: Mastering the Art of Price Patterns
Understanding and interpreting price patterns is an essential skill in a trader’s arsenal. These patterns offer a window into the market’s probable next move, providing an edge in decision-making. However, it’s crucial to use them in conjunction with other technical analysis tools and fundamental analysis to validate their signals. As in any aspect of trading, practice, patience, and continuous learning are key to mastering the use of price patterns.
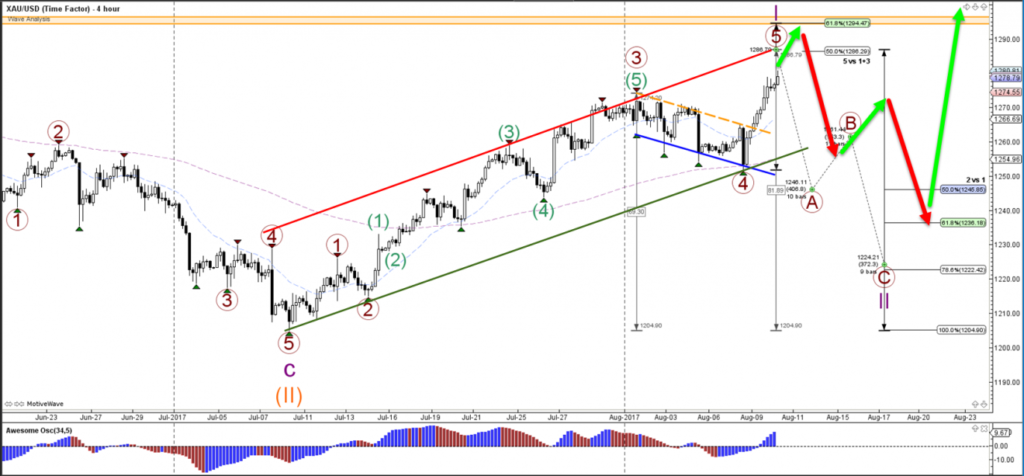
Figure title: Analysis of XAU/USD Price Patterns
Fonte: Elite CurrenSea: Link
Descrição: The image is a detailed analysis of the XAU/USD (Gold/US Dollar) currency pair, focusing on price patterns over a 4-hour time frame. It includes various technical analysis elements such as trend lines, support and resistance levels, and possibly specific trading patterns like triangles, head and shoulders, or channels. The chart probably shows how these technical tools and patterns are applied to the XAU/USD pair to predict future price movements, identify trading opportunities, or highlight key areas of interest for traders.
Principais conclusões:
- Technical Analysis Tools: Use of trend lines, support and resistance levels in analyzing the XAU/USD pair.
- Price Patterns: Identification of specific patterns that indicate potential future price movements.
- 4-Hour Time Frame: Analysis over a medium-term period, providing a balance between short-term fluctuations and longer-term trends.
- Trading Insights: The chart offers insights into potential entry and exit points, and areas of price reversal or continuation.
Aplicativo: For traders in the Forex and commodities markets, understanding how to analyze and interpret price patterns is crucial. This knowledge helps in making informed decisions about when to enter or exit trades, particularly in a volatile market like gold. The ability to read and analyze charts over different time frames, like the 4-hour chart in this case, is essential for developing a versatile trading strategy that can adapt to changing market conditions. This chart analysis is particularly useful for medium-term traders who balance the need for detailed market information with the broader perspective of longer-term trends.
Part 4: The Importance of Multiple Timeframe Analysis

Figura: A stock photo focusing on the concept of Forex and binary options trading. It features a candle chart and indicator display set on a 1-minute timeframe, all against a dark background. This image captures the intensity and complexity of short-term trading strategies in the financial markets.
Fonte: Shutterstock
Multiple timeframe analysis involves looking at the same asset across different timeframes to get a more comprehensive view of its trend. For example, a trader might look at a daily chart to determine the overall trend, then switch to a 1-hour chart to find a good entry point. Real-world examples will be provided to demonstrate this process.
Figure title: Multi-Timeframe Trade Analysis Example
Fonte: ForexOp
Descrição: The image is an example of multi-timeframe trade analysis, a technique used in Forex trading. It shows charts of the same currency pair or financial instrument across different timeframes, such as daily, hourly, or 15-minute charts. This approach helps traders understand the broader market trend while also capturing shorter-term fluctuations. The image may include indicators like moving averages, MACD (Moving Average Convergence Divergence), or RSI (Relative Strength Index) on each chart, providing insights into market momentum, trend strength, and potential reversal points across different timeframes.
Principais conclusões:
- Multiple Timeframes: Analysis across various time frames provides a comprehensive view of market trends.
- Trend Confirmation: Longer-term charts for trend identification and shorter-term charts for entry and exit points.
- Technical Indicators: Use of indicators like MACD and RSI to validate trends and signals across timeframes.
- Negociação Estratégica: Helps in making informed trading decisions by aligning short-term actions with long-term trends.
Aplicativo: For Forex traders, multi-timeframe analysis is a valuable strategy for enhancing trade accuracy and effectiveness. By analyzing a currency pair across different timeframes, traders can confirm the overall market trend and fine-tune their entry and exit points based on shorter-term price movements. This method is particularly useful for avoiding false signals and improving the timing of trades. It allows traders to align their strategies with the broader market direction while capitalizing on short-term opportunities, making it a versatile approach for both day trading and swing trading.
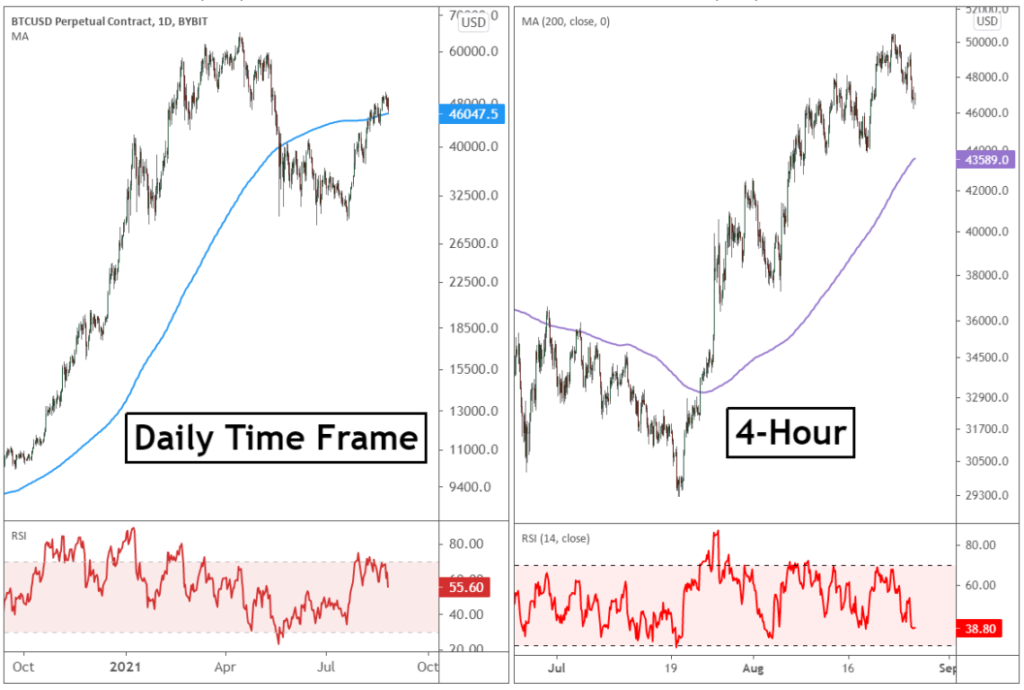
Figure title: Multi-Time Frame Analysis in Trading
Fonte: Bybit Learn:
Descrição: The image likely illustrates the concept of multi-time frame analysis in trading. This technique involves examining the same asset or market across different time frames – for example, daily, hourly, and 15-minute charts – to gain a comprehensive understanding of market trends and potential trade opportunities. The image may display how trends and patterns observed in a longer time frame (like the daily chart) can be refined and exploited in shorter time frames (like the hourly or 15-minute charts) for precise entry and exit points.
Principais conclusões:
- Comprehensive Market View: Multi-time frame analysis provides a more complete view of market trends and potential reversals.
- Alignment of Trends: It helps in aligning trading strategies with both long-term and short-term market movements.
- Refined Entry and Exit Points: Traders can use shorter time frames to pinpoint precise entry and exit points within the broader trend identified in longer time frames.
- Gerenciamento de riscos: This approach aids in better risk management by confirming trends across multiple time frames.
Aplicativo: Multi-time frame analysis is a valuable technique for traders in various markets, including forex, stocks, and cryptocurrencies. By applying this method, traders can enhance their understanding of market dynamics, improve the timing of their trades, and increase the probability of successful trades. It is particularly useful for day traders and swing traders who need to balance the immediacy of short-term market movements with the context provided by longer-term trends. This approach helps in making more informed decisions, managing risks effectively, and adapting to changing market conditions.
Resumo
Trend analysis forms the backbone of technical analysis. By identifying the prevailing trend, drawing trendlines and channels, recognizing price patterns, and applying multiple timeframe analysis, traders can make informed decisions about when to enter and exit trades.
As we proceed to the next chapters, you’ll discover more tools that, combined with your understanding of trends, will equip you to navigate the ever-changing financial markets. Stay tuned!
Principais informações da lição:
Declaração de encerramento: Mastery of Trend Analysis, understanding Price Patterns, and the strategic application of Multiple Timeframe Analysis significantly elevate your trading capabilities. These techniques allow for a nuanced approach to market analysis, enabling you to align your strategies with both short-term fluctuations and long-term trends. As you continue to apply and refine these skills, the disciplined integration of trend analysis, pattern recognition, and multi-timeframe scrutiny will serve as the cornerstone of your trading success, bolstering your ability to navigate the financial markets with precision and strategic foresight.
- Trends, Trendlines, and Channels are essential for visualizing market direction and planning trades accordingly.
- Price Patterns reveal crucial insights into potential market movements, guiding traders towards more accurate predictions and strategic decision-making.
- Multiple Timeframe Analysis provides a comprehensive view of market dynamics, enhancing the identification of reliable trading signals and the timing of trades.
- The synergy of technical indicators with trend analysis and price patterns underpins a sophisticated approach to market analysis, optimizing trading strategies for higher accuracy and efficiency.
