
Capítulo 2: Mecânica de Mercado
Objetivos de aprendizagem da lição:
Introdução: This chapter delves into the intricacies of Market Mechanics, Supply and Demand, Market Participants, Global Market Operations, and the core dynamics of financial markets through Trends, Ranges, and Market Cycles. By understanding these fundamental concepts, you’ll be equipped to navigate the complexities of the financial markets with greater insight, enabling more informed and strategic trading and investment decisions. From the forces that drive market prices to the continuous operation of the Forex market, and from identifying market trends to comprehending market cycles, this comprehensive exploration prepares you to predict future market movements and craft effective trading strategies with confidence.
- Understand Market Supply and Demand: Grasp the fundamental economic principles that drive market prices and apply these insights to trading and investment.
- Recognize the Role of Market Participants: Learn about the diverse influence of individual investors, large institutions, and their impact on market dynamics.
- Explore Global Market Operations and Market Cycles: Gain a deeper understanding of the 24-hour trading environment and the cyclical nature of markets, including economic boom and bust cycles.
- Identify and Understand Market Trends and Range-Bound Markets: Discover how to guide your trading decisions through the analysis of bullish, bearish, and sideways trends, and how to identify opportunities within stable price ranges.
Introdução
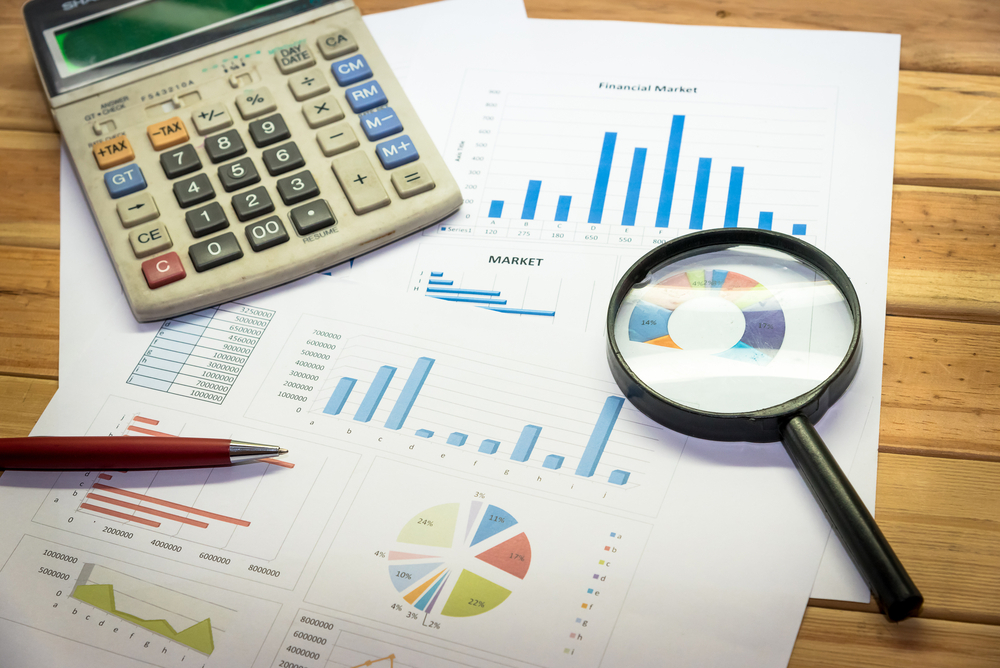
Figura: An image showcasing data analysis in the forex market, featuring a magnifying glass, pen, and calculator over financial charts and summary information. This scene emphasizes the detailed examination of forex trading instruments.
Fonte: Shutterstock
The magic of the market arises from its dynamics. In this chapter, we delve into the mechanics of how markets operate, the role of supply and demand, the influence of different market participants, and the foundational concepts of trends, ranges, and market cycles. Welcome to the fascinating world of market mechanics!
A. Understanding Market Supply and Demand

Figura: A 3D isometric flat vector conceptual illustration of ‘Demand Vs Supply’, representing the main model of price determination used in economic theory. This image visually interprets key concepts in economics.
Fonte: Shutterstock
Market Supply and Demand are key principles in economics and trading, profoundly influencing the prices of securities. When demand for a security exceeds its supply, prices tend to rise. Conversely, when supply outweighs demand, prices are likely to drop.
Think of it as an auction, where a popular item with limited availability (high demand, low supply) fetches a higher price. In contrast, a common item available in excess (low demand, high supply) tends to sell for less.
Example: If a publicly traded company reports higher-than-expected earnings, more investors may want to buy the company’s shares (increase in demand), causing the share price to rise.
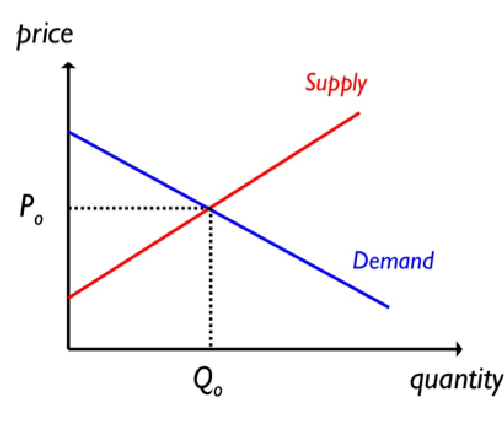
Figure title: Basic Supply and Demand Curves
Fonte: ResearchGate
Descrição: The image is a basic representation of supply and demand curves in economics. It features two intersecting lines on a graph, with the horizontal axis representing quantity and the vertical axis representing price. The downward-sloping line represents the demand curve, indicating that as the price decreases, the quantity demanded increases. Conversely, the upward-sloping line represents the supply curve, showing that as the price increases, the quantity supplied increases. The point where these two curves intersect is known as the market equilibrium, where the quantity supplied equals the quantity demanded.
Principais conclusões:
- Demand Curve: Downward slope, indicating an inverse relationship between price and quantity demanded.
- Supply Curve: Upward slope, showing a direct relationship between price and quantity supplied.
- Market Equilibrium: The intersection point of the supply and demand curves.
- Price and Quantity Dynamics: Illustrates how price affects the quantity supplied and demanded.
Aplicativo: Understanding supply and demand curves is fundamental for anyone studying economics, finance, or business. These curves help in analyzing market dynamics, such as how changes in production costs or consumer preferences can affect prices and quantities. For investors and business professionals, this knowledge is crucial in making informed decisions about pricing, production levels, and market entry. It also aids in predicting how economic policies or external factors might impact markets.
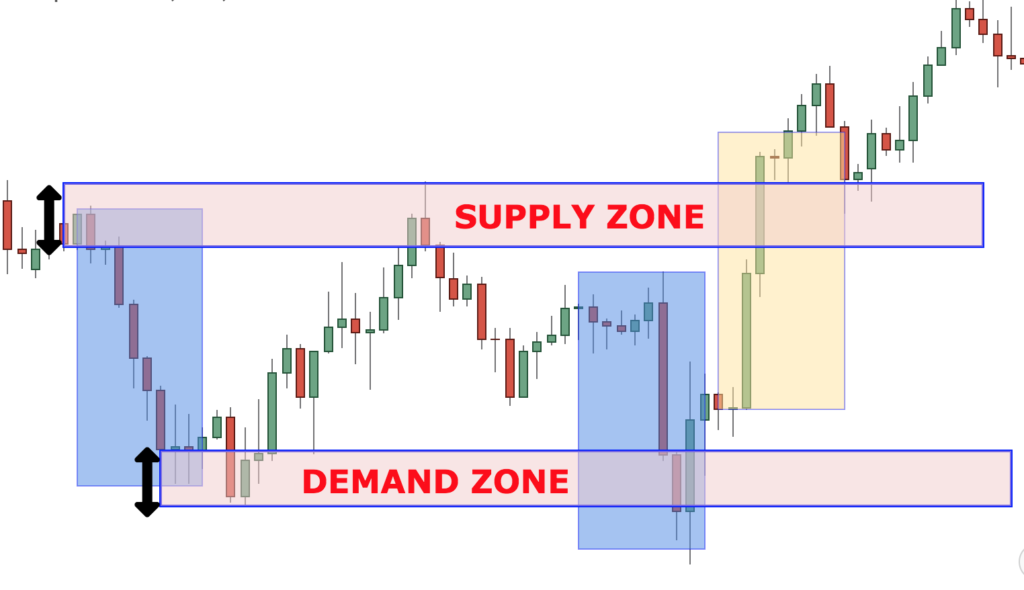
Figure title: Supply and Demand Zones in Trading
Fonte: Colibri Trader
Descrição: The figure displays two key concepts in trading: the Supply Zone and the Demand Zone. These zones are areas on a price chart that indicate where the price of an asset has made a strong move either upwards or downwards. The Supply Zone is typically where there’s a surplus of an asset, leading to a price drop. Conversely, the Demand Zone is where there’s a shortage, causing the price to rise. These zones are crucial for traders to identify potential areas where the price is likely to reverse.
Principais conclusões:
- Supply Zones are areas where sellers are likely to enter the market, causing the price to drop.
- Demand Zones are areas where buyers are likely to enter the market, pushing the price up.
- Identifying these zones can help predict price reversals.
- These zones are based on historical price movements and are used for future predictions.
Aplicativo: Understanding Supply and Demand Zones is vital for traders in making informed decisions about entry and exit points in the market. By identifying these zones, traders can anticipate potential price movements and adjust their strategies accordingly. This knowledge is particularly useful for short-term traders and those who use análise técnica as a part of their trading strategy. Recognizing these zones allows traders to capitalize on price movements, thereby enhancing their chances of making profitable trades.
B. Market Participants and Their Influence
Market participants are entities that buy and sell securities in the financial markets. They range from individual retail investors and day traders to big players like institutional investors, which include pension funds, mutual funds, insurance companies, and commercial banks.
Each participant brings different amounts of capital, levels of knowledge, and trading strategies, influencing the market’s supply and demand. Large institutional investors, due to the sheer volume of their trades, can notably affect the price of a security.
Did You Know?: Some market participants, known as “market makers,” provide liquidity to the markets by continuously buying and selling securities, helping to keep markets efficient.
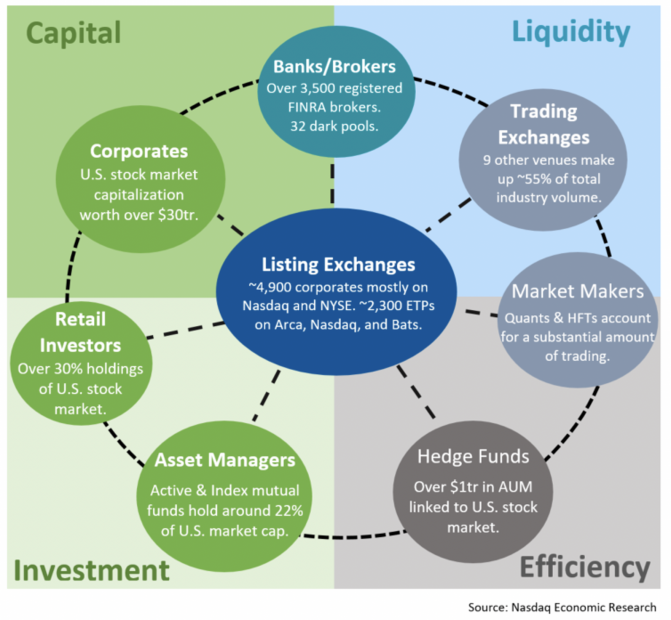
Figure title: U.S. Stock Market Participants and Volume Distribution
Source: Nasdaq
Descrição: The infographic provides an overview of the key participants in the U.S. stock market and their respective roles. It includes information about over 3,500 registered FINRA brokers, 32 dark pools, and 9 other trading venues that make up approximately 55% of the total industry volume. The image also highlights the presence of 4,900 corporates, mostly on Nasdaq and NYSE, and around 2,300 Exchange-Traded Products (ETPs) on Arca, Nasdaq, and Bats. Additionally, it mentions hedge funds with over $1 trillion in Assets Under Management (AUM) linked to the U.S. stock market.
Principais conclusões:
- Diverse Market Participants: The U.S. stock market includes a wide range of participants, from brokers to hedge funds.
- Significant Trading Venues: Exchanges and dark pools play a crucial role in the market’s liquidity and trading volume.
- Hedge Funds’ Influence: With substantial AUM, hedge funds are significant players in the market.
Aplicativo: Understanding the various market participants and their roles can help investors and traders comprehend market dynamics and liquidity. This knowledge is essential for making informed investment decisions and understanding the impact of different entities on market movements.
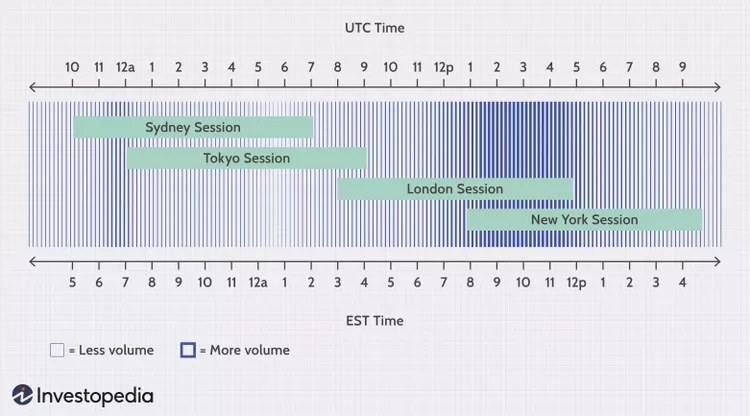
Figure title: Forex Market Trading Hours
Fonte: Investopedia
Descrição: The image is a graphical representation of the Forex (foreign exchange) market’s trading hours across different global financial centers. It shows how the Forex market operates 24 hours a day through a network of exchanges in major cities around the world. The graphic illustrates the overlapping trading sessions of cities like Sydney, Tokyo, London, and New York. This continuous operation is due to the different time zones each financial center is located in, allowing traders to conduct transactions at almost any time of the day.
Principais conclusões:
- Global Operation: The Forex market operates continuously due to the different time zones of major financial centers.
- Overlapping Sessions: Trading sessions in cities like Sydney, Tokyo, London, and New York overlap, providing continuous trading opportunities.
- 24-Hour Market: This feature of the Forex market offers flexibility for traders to operate beyond the traditional market hours.
Aplicativo: For investors and traders, understanding the Forex market’s 24-hour cycle is crucial for strategizing their trades. This knowledge allows for taking advantage of trading opportunities that arise in different time zones and reacting promptly to global financial news and events. It’s particularly beneficial for those who trade internationally or prefer trading during specific hours, offering the flexibility to choose the most suitable times for their trading activities.
C. Trends, Ranges, and Market Cycles
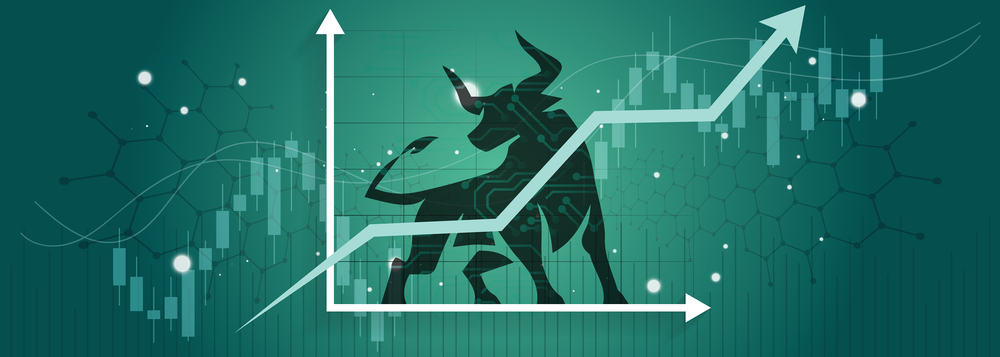
Figura: A vector illustration depicting a bull run or bullish market trend, particularly in the context of cryptocurrency or stock markets. It features an upward arrow graph symbolizing the increase in rates, along with elements representing cryptocurrency price charts and blockchain technology, indicative of a global economic boom.
Fonte: Shutterstock
The three essential components of market mechanics are trends, ranges, and market cycles.
Tendências: A trend refers to the general direction in which the price of an asset is moving. Trends can be upward (bullish), downward (bearish), or sideways (neutral). Identifying these trends is a crucial part of technical analysis.
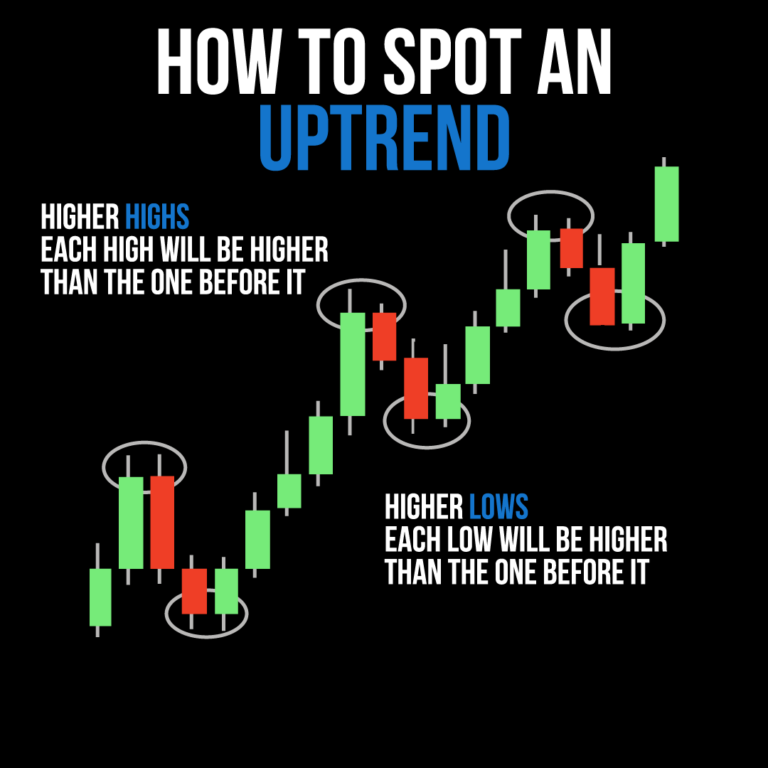
Figure: How to Spot an Uptrend
Fonte: Infográfico personalizado
Descrição: This infographic explains how to identify an uptrend in a financial market. An uptrend is characterized by ‘Higher Highs’ and ‘Higher Lows.’ ‘Higher Highs’ means each successive peak (high point) of the price is higher than the previous one. Similarly, ‘Higher Lows’ indicates that each low point is higher than the previous low, suggesting a consistent upward movement in price. This pattern is a fundamental concept in technical analysis, indicating a bullish market sentiment. It’s important for traders to recognize these patterns as they can signal potential investment opportunities.
Ranges: A range occurs when a security’s price oscillates between a high and a low for a particular period. This ‘ranging’ period signifies a market in equilibrium, with neither the bulls nor the bears able to gain the upper hand.
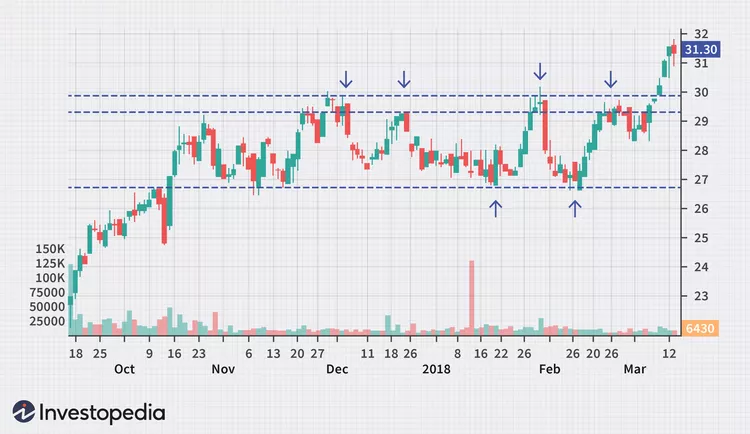
Figure title: Range-Bound Trading in Markets
Fonte: Investopedia
Descrição: The image illustrates the concept of range-bound trading in financial markets. Range-bound trading occurs when a security’s price oscillates within a relatively stable range, marked by a consistent upper resistance level and a lower support level. The graph shows a horizontal channel where the price of the asset moves back and forth between these two levels. This type of market condition is characterized by a lack of a clear trend in either direction, making it distinct from bullish or bearish market trends.
Principais conclusões:
- Stable Price Range: Range-bound markets are characterized by a security’s price moving within a stable range.
- Resistance and Support Levels: The upper and lower boundaries of the range act as resistance and support levels, respectively.
- Lack of Clear Trend: These markets do not exhibit a strong upward or downward trend.
- Trading Strategy: Traders often buy at or near the support level and sell at or near the resistance level in range-bound markets.
Aplicativo: For investors and traders, recognizing a range-bound market is crucial for applying appropriate trading strategies. In such markets, the focus is on buying low and selling high within the defined range, rather than anticipating significant trend movements. This approach is particularly useful for short-term traders who capitalize on these smaller, more predictable price movements. Understanding range-bound trading helps in diversifying trading strategies and can be effective in periods of market consolidation.
Market Cycles: Markets often move in cycles, or phases of bullish (upward) and bearish (downward) trends. Understanding these cycles can provide insights into potential future price movements.
Exemplo: The Economic Cycle, composed of periods of expansion (bullish) and recession (bearish), impacts various sectors and securities differently, influencing investors’ decisions.
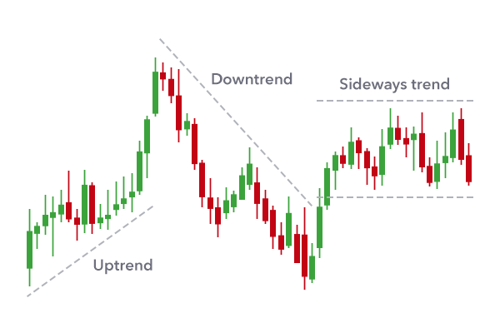
Figure title: Trends and Channels in Technical Analysis
Fonte: StockSharp
Descrição: The image is a graphical representation of trends and channels in technical analysis, specifically focusing on an uptrend. An uptrend is characterized by a series of higher highs and higher lows, indicating a general increase in price over time. The chart shows a rising trend line that connects the lows, and a parallel line may be drawn at the highs to create a channel. This channel helps in identifying potential areas of support and resistance within the trend.
Principais conclusões:
- Uptrend Identification: Recognizing an uptrend involves looking for a pattern of higher highs and higher lows.
- Trend Lines: These are drawn to connect the lows in an uptrend, helping to identify the trend’s direction.
- Channels: Parallel lines to the trend line can form a channel, marking potential support and resistance areas.
- Continuation Pattern: An uptrend is generally seen as a bullish continuation pattern, suggesting further price increases.
Aplicativo: For investors and traders, identifying an uptrend is crucial for making strategic decisions. In an uptrend, traders might look for buying opportunities at or near the trend line (support level) and consider selling as the price approaches the upper channel line (resistance level). Understanding trends and channels is essential for both short-term trading and long-term investment strategies, as it helps in predicting future price movements and in setting appropriate entry and exit points. This knowledge is particularly valuable in bullish markets, where the aim is to capitalize on the continuing upward movement of prices.
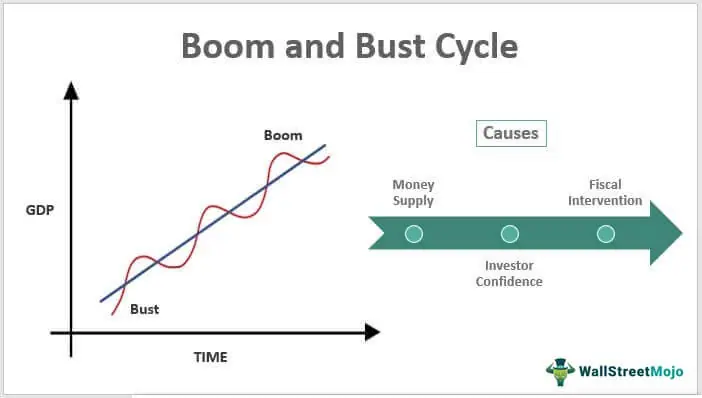
Figure title: Boom and Bust Cycle in Economics
Fonte: Wall Street Mojo
Descrição: The image depicts the concept of the Boom and Bust Cycle in economics. This cycle is a pattern of economic expansion (boom) and contraction (bust) that typically occurs in capitalist economies. The graph shows a wave-like pattern over time, with the ‘boom’ phase characterized by factors like increased money supply, fiscal intervention, and high investor confidence, leading to economic growth. Conversely, the ‘bust’ phase follows, marked by a decline in these factors, resulting in economic slowdown or recession. The cycle then repeats, illustrating the cyclical nature of economies.
Principais conclusões:
- Economic Fluctuations: The Boom and Bust Cycle represents the natural fluctuation of an economy between periods of growth and decline.
- Boom Phase: Characterized by increased money supply, government intervention, and high investor confidence, leading to economic expansion.
- Bust Phase: Marked by a decrease in these factors, leading to economic contraction or recession.
- Cyclical Nature: This cycle is inherent in capitalist economies, indicating the recurring periods of expansion and contraction.
Aplicativo: Understanding the Boom and Bust Cycle is crucial for investors, economists, and policy makers. It helps in anticipating market trends and economic shifts, allowing for better preparation and response to changing economic conditions. For investors, recognizing these cycles can guide investment decisions, such as when to enter or exit the market. Policymakers can use this knowledge to implement measures to mitigate the effects of busts and prolong booms. This cycle highlights the importance of economic diversification and risk management in both personal finance and broader economic policy.
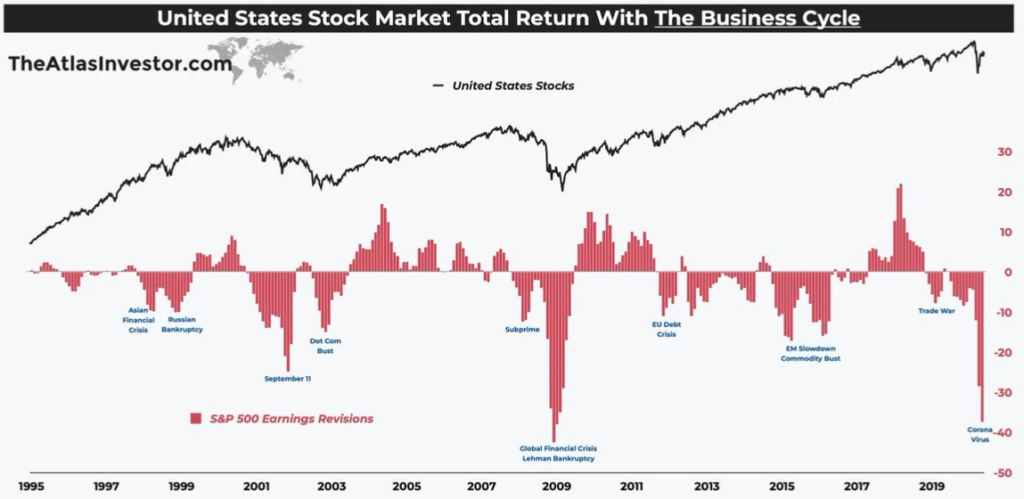
Figure title: United States Stock Market Total Return and Business Cycle
Fonte: Investing.com
Descrição: The image is a graph showing the total return of the United States stock market in relation to the business cycle from 1995 to 2019. It highlights key periods in the U.S. economy, such as the subprime mortgage crisis around 2007-2009. The graph demonstrates how the stock market’s total return has fluctuated over these years, with notable peaks and troughs corresponding to various economic events and cycles. This visualization helps in understanding the long-term trends in the U.S. stock market and its correlation with broader economic conditions.
Principais conclusões:
- Long-term Trends: The graph shows the long-term trends in the U.S. stock market’s total return over a period of more than two decades.
- Economic Correlation: It highlights the correlation between stock market performance and major economic events, like the subprime mortgage crisis.
- Cyclical Nature: The stock market’s performance is shown to be cyclical, with periods of growth followed by downturns.
Historical Context: Provides a historical context for understanding current market conditions and potential future trends.
Aplicativo: For investors and those learning about stock market investing, this graph offers valuable insights into how economic cycles can impact market performance. Understanding these long-term trends can aid in making more informed investment decisions, particularly in terms of risk management and portfolio diversification. It also underscores the importance of considering historical market performance and economic indicators when planning investment strategies, especially for long-term investments. This knowledge is crucial for developing a well-rounded perspective on stock market dynamics.
Summary
In this chapter, we’ve dissected the integral mechanics of the market. We’ve grasped the fundamental concepts of supply and demand and understood the influence of different market participants. We’ve also traversed the landscapes of trends, ranges, and market cycles.
As we move forward, remember that these foundational concepts will continually resurface. They underpin the more advanced strategies we will explore later in this course. With every step, we’re getting closer to becoming proficient in technical analysis.
Market mechanics may feel like a puzzle with many moving pieces. However, each piece has its place and role, creating a unique and intricate picture. Let’s continue piecing together this exciting puzzle!
Informações importantes da lição:
Declaração de Encerramento: Mastery of Market Mechanics, understanding Supply and Demand, recognizing the roles of various market participants, and a deep dive into the dynamics of Trends, Ranges, and Market Cycles are essential for anyone aiming to excel in the financial markets. These foundational concepts and detailed insights prepare you to analyze market trends, navigate through various market conditions, and capitalize on trading opportunities with enhanced effectiveness. Equipped with this knowledge, you’re now better positioned to anticipate market shifts, implement strategic trading decisions, and optimize your investment strategies by leveraging the natural rhythms of the market and understanding the broader macroeconomic environment’s impact on markets.
- The interplay of Supply and Demand is critical in market price determination, offering a strategic edge in decision-making processes.
- Market Participants’ influence and the 24-hour Forex market cycle provide unique trading opportunities and challenges, emphasizing the need for flexibility and strategic planning.
- Understanding Market Trends, Ranges, and Cycles enhances strategic decision-making, allowing for the prediction of future market movements and the identification of optimal trading strategies.
- Knowledge of Economic Boom and Bust Cycles adds a macroeconomic perspective to market analysis, aiding in more informed and comprehensive investment decisions.
