Capítulo 1: Introdução à Análise Técnica
Objetivos de aprendizagem da lição:
Introdução: Embark on an enlightening journey through the realms of Análise Técnica e Análise Fundamental to master the art of market prediction and strategy formulation. This comprehensive chapter serves as your gateway to understanding how historical and current market data, including price and volume, can be leveraged to forecast future price movements. By exploring the evolution, underlying principles, and practical tools of Technical Analysis—such as Médias Móveis, MACD, e Bollinger Bands—alongside the foundational concepts of Fundamental Analysis, you’ll gain a holistic view of market analysis techniques. This approach not only enhances your investment strategies but also equips you with the ability to navigate and interpret market trends effectively, ensuring well-rounded mastery over market predictions.
- Understand the fundamentals and practical tools of Technical Analysis: Grasp how to evaluate securities using historical market activity data to forecast future price movements.
- Learn the history, evolution, and core principles of Technical Analysis: Gain insight into the development and significance of Technical Analysis in financial markets, including the importance of recognizing market trends and patterns.
- Distinguish between Technical and Fundamental Analysis: Master the differences and synergies between these two analysis methods, guiding your investment strategy selection.
- Familiarize yourself with key analysis tools: Acquire practical knowledge of various analysis tools and indicators essential for market trend analysis and making informed trading decisions.
Introdução
Technical Analysis is an important tool in the financial world, used extensively by traders and investors to forecast the direction of prices. This chapter uncovers the essence of technical analysis, its history, the key differences from fundamental analysis, the underlying principles, and its significance in today’s financial markets. Let’s embark on this enlightening journey!
A. Overview of Technical Analysis

Figura: Vector illustration depicting technical analysis in stock trading, showcasing various graphs and indicators used in evaluating stock market trends.
Fonte: Shutterstock
Technical Analysis involves evaluating securities by analyzing statistics generated by market activity, such as price and volume. It utilizes charts, patterns, and indicators to interpret past market behavior and predict future price trends.
Technical analysts, often referred to as “chartists,” operate on the principle that historical price movements can hint at future market trends. They analyze price patterns, market trends, and volume data and apply an array of analytical tools to aid their buy or sell decisions.
Example: A technical analyst might use a basic tool like a trend line, which displays a security’s directional trend, to decide when to enter or exit a market. If the security price breaches the trend line, it could be interpreted as a signal to buy or sell.
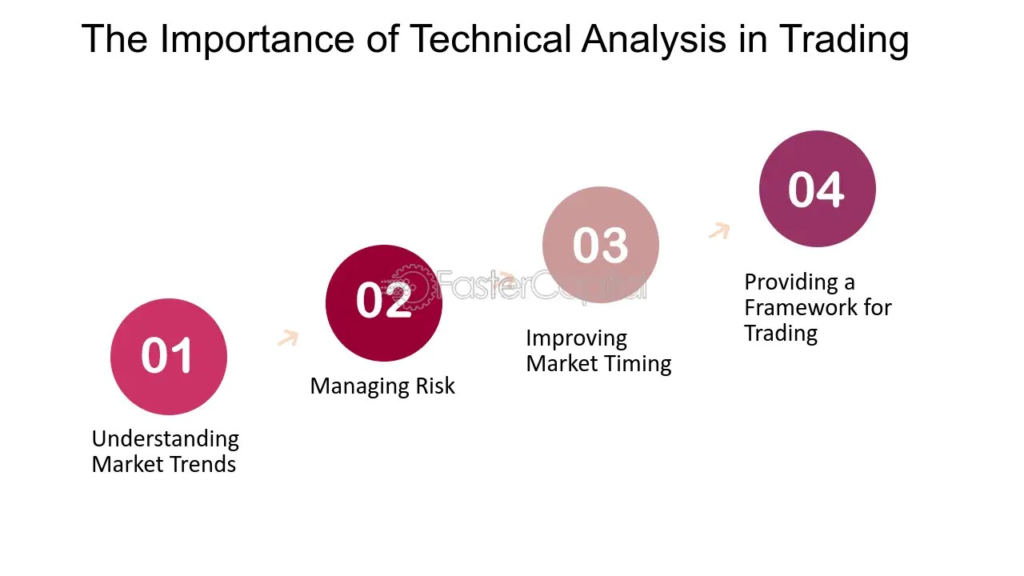
Figura: This infographic, titled “Technical Analysis: Decoding Technical Analysis & Tools for Trading Success,” provides a comprehensive overview of the importance of technical analysis in trading. It highlights key tools and strategies used in technical analysis, which is essential for understanding market trends and making informed trading decisions. The infographic is designed to be user-friendly, making it a great resource for both novice and experienced traders. It emphasizes the significance of technical analysis in predicting future market movements and in the strategic planning of trades. For users looking to delve into trading, this infographic serves as a practical guide to the basics of technical analysis, offering insights into how to leverage these tools for trading success.
Source: Custom Infographic from FasterCapital
B. History and Evolution

Figura: A magnifying glass placed over a graph, symbolizing the basic tools used in technical analysis of the stock market. This image highlights the detailed examination of market trends.
Fonte: Shutterstock
The practice of Technical Analysis, though it has been around for centuries, got a firm foundation in the late 19th century with Charles Dow’s theories. Dow Theory, which seeks to interpret the market’s price movements, is a fundamental piece of today’s Technical Analysis.
In the 20th century, the advent of computers and advancements in technology sparked a revolution in Technical Analysis. The introduction of digital charts and real-time data facilitated quicker analysis and response to market changes.
Did You Know? The earliest instances of Technical Analysis can be traced back to the 18th-century use of “candlestick” patterns in Japan, which served to predict the price of rice contracts.
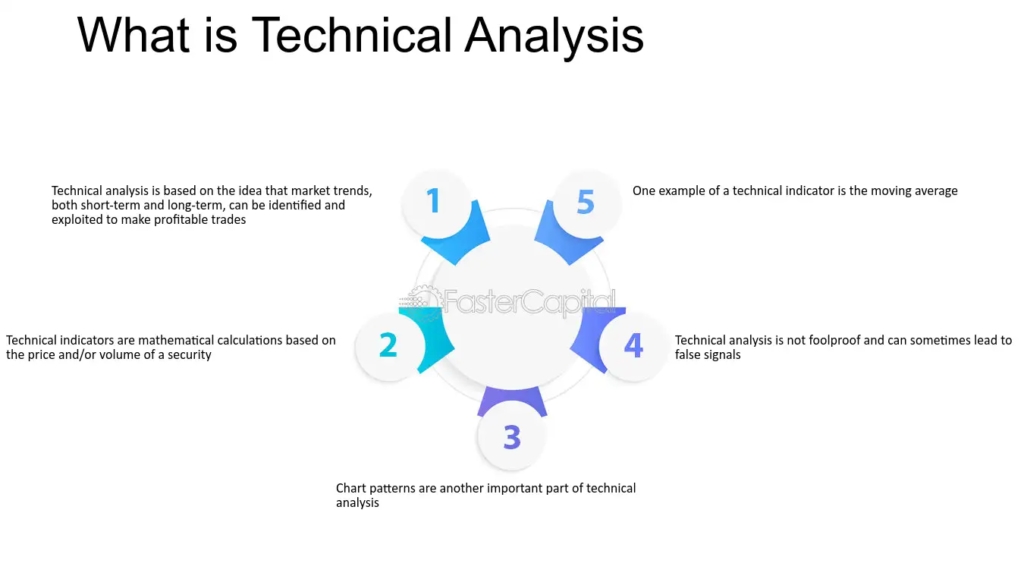
Figura: This infographic, titled “What is Technical Analysis,” offers a clear and concise explanation of technical analysis in the context of trading. It breaks down the concept into easily understandable parts, explaining how traders use past market data, primarily price and volume, to forecast future price movements. The infographic is particularly useful for beginners, providing a solid foundation for understanding how technical analysis aids in making informed trading decisions. It emphasizes the role of historical data in predicting market trends and the importance of this analysis in the strategic planning of trades.
Source: Custom Infographic from FasterCapital

Figura: This infographic, titled “What Is Technical Analysis?”, provides an insightful overview of the fundamental aspects of technical analysis in trading. It explains that technical analysis is the study of market actions, emphasizing three core principles: market actions discount everything, history repeats itself, and prices move in trends. This visual guide is ideal for beginners, offering a clear understanding of how technical analysis interprets market behavior and trends based on historical data. It’s a useful resource for anyone interested in learning the basics of market analysis and how it can be applied to make informed trading decisions.

Figura: This infographic, titled “Technical Analysis Indicators,” provides a detailed overview of various key indicators used in technical analysis. It includes indicators such as Moving Average, Convergence and Divergence (MACD), Bollinger Bands, Money Flow Index, Moving Averages, Relative Strength Indicator (RSI), and Fibonacci Retracement. Each of these tools plays a crucial role in analyzing market trends and making informed trading decisions. The infographic is a valuable resource for traders and investors, offering a quick reference to understand how these indicators work and their significance in technical analysis. It’s particularly beneficial for those new to trading, helping them to familiarize themselves with essential tools for market analysis.
Source: Custom Infographic from Wall Street Mojo

Figure title: Technical Analysis: Entry and Exit Points
Fonte: Market Realist
Descrição: The image is a chart illustrating the concepts of entry and exit points in technical analysis for stock trading. It shows a stock price trend line, with specific points marked as ideal entry and exit points for traders. Entry points are where traders might consider buying the stock, typically at the start of an upward trend. Exit points are marked where the trend appears to reverse or slow down, indicating a potential sell signal.
Principais conclusões:
- Identifying Trends: The chart emphasizes the importance of identifying upward and downward trends in stock prices.
- Entry Points: These are optimal moments for investors to enter the market or buy a stock, usually at the beginning of an upward trend.
- Exit Points: These points suggest when to sell or exit the market to maximize gains or minimize losses, often at the peak or just before a downward trend.
- Gestão de Riscos: The concept of entry and exit points is crucial for effective risk management in trading.
Aplicativo: For investors and those learning about stock investing, understanding entry and exit points is key for successful trading strategies. This knowledge helps in making informed decisions about when to buy or sell stocks, aiming to maximize profits and minimize losses. It’s a fundamental aspect of risk management in investment, allowing traders to better navigate the volatility of the stock market. This chart can serve as a practical guide for timing market participation.
Figure title: Technical Analysis Tools and Indicators
Fonte: Encyclopædia Britannica: Link
Descrição: This figure illustrates various technical analysis tools and indicators used in stock market trading. The figure categorizes indicators into five main types: trend-following indicators, momentum indicators, volatility indicators, volume indicators, and support and resistance tools. Each category serves a specific purpose in analyzing market trends, momentum, volatility, trade volume, and identifying potential support and resistance levels in stock prices. These indicators include popular tools like Moving Averages, MACD, RSI, Bollinger Bands, and Fibonacci retracements, each providing unique insights into market behavior.
Principais conclusões:
- Technical indicators are essential tools in stock market analysis, helping to predict future market movements.
- Trend-following indicators, like Moving Averages, assist in identifying the direction of a stock’s trend.
- Momentum indicators, such as MACD and RSI, measure the strength and speed of a stock’s price movement.
- Volatility indicators, including Bollinger Bands, help assess the likelihood of price fluctuations.
- Volume indicators provide insights into trading volume, offering clues about market sentiment.
- Support and resistance tools, like Fibonacci, aid in identifying key price levels that might act as barriers.
Aplicativo: Investors and traders can use these indicators to make informed decisions about when to buy or sell stocks. By understanding and applying these tools, one can identify potential entry and exit points in the market, gauge market sentiment, and manage risk more effectively. For instance, a rising Moving Average might suggest a good time to buy, while an RSI indicating overbought conditions could signal a potential sell opportunity. These indicators are valuable for both short-term trading and long-term investment strategies, making them crucial for anyone involved in stock market investing.
C. The Difference between Technical and Fundamental Analysis
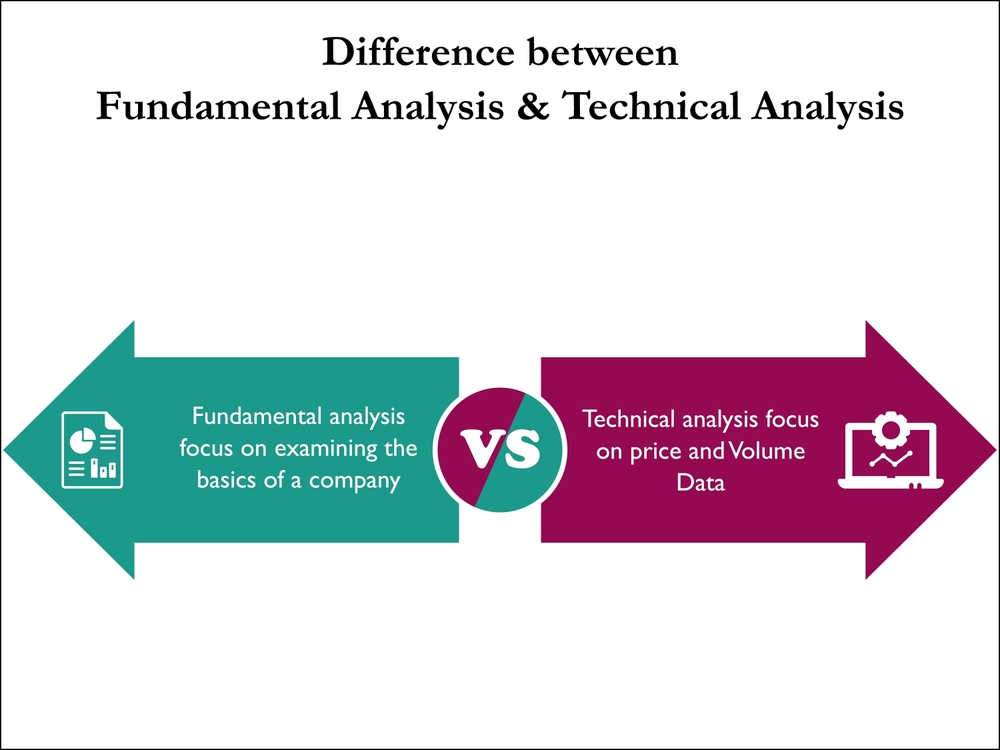
Figura: An infographic vector illustrating the concepts of fundamental and technical analysis in finance, complete with descriptive icons. This image serves as a visual guide to key analytical approaches in stock market assessment.
Fonte: Shutterstock
Technical Analysis and Fundamental Analysis are the two primary methodologies employed by traders and investors to evaluate and predict financial markets, albeit from different perspectives.
Technical Analysis concentrates on analyzing price data patterns to forecast future pricing and volume trends. It revolves around answering the “what” (what is the price doing?) and the “when” (when should I buy or sell?).
On the other hand, Fundamental Analysis investigates the “why” behind price movements. It appraises the intrinsic value of an asset, factoring in economic, financial, and other qualitative and quantitative aspects.
Each method has its pros and cons, and employing them in unison can provide a holistic view of the market.
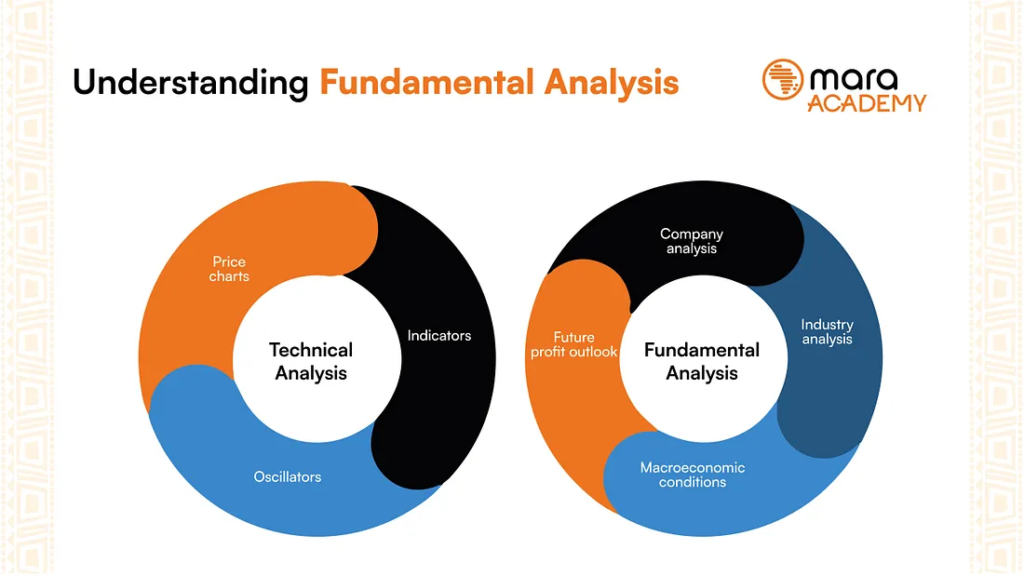
Figura: This infographic, titled “Understanding Fundamental Analysis,” provides a comprehensive guide to the key aspects of fundamental analysis in finance. It explains how fundamental analysis involves evaluating a company’s financial statements and health, its management and competitive advantages, and its competitors and markets. It emphasizes the importance of looking beyond just the numbers and considering the overall picture of a company’s potential for growth and profitability. This visual guide is particularly useful for those interested in long-term investments and seeking to understand the intrinsic value of stocks.
Source: Custom Infographic from Medium
D. Principles of Technical Analysis

Figura: A close-up image of a finger pressing a keyboard key with the words “TECHNICAL ANALYSIS” on it, symbolizing the active engagement in financial market analysis.
Fonte: Shutterstock
Three core assumptions underlie technical analysis:
- The Market Discounts Everything: All known and unknown information, including a company’s fundamentals and wider economic factors, is reflected in the price, which suggests market efficiency.
- Price Moves in Trends: Prices often follow trends that can be classified as short-term, medium-term, or long-term. The objective of technical analysts is to identify these trends and make trading decisions accordingly.
- History Tends to Repeat Itself: Market participants, being humans, tend to react in predictable ways to market stimuli. These reactions create patterns that often repeat over time. Recognizing these patterns, technical analysts aim to anticipate price movements.
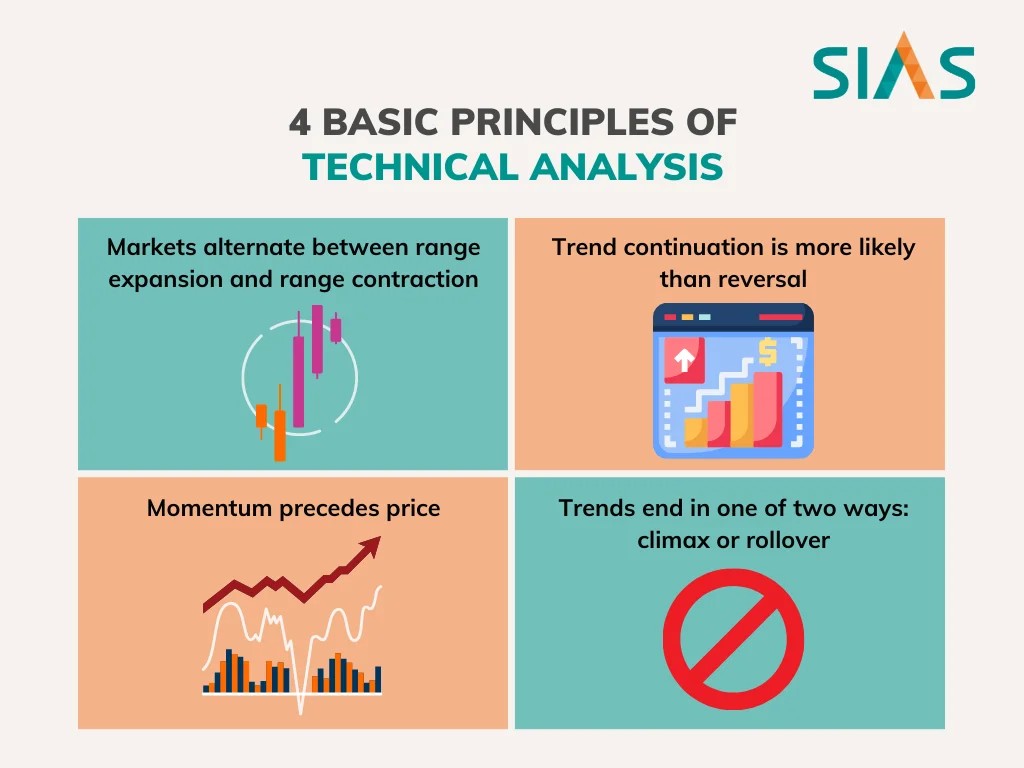
Figura title: 4 Basic Principles of Technical Analysis
Fonte: SIAS
Descrição: The infographic outlines four fundamental principles of technical analysis in trading. These principles include the concept that markets alternate between range expansion and range contraction, the likelihood of trend continuation over reversal, the idea that momentum precedes price, and the notion that trends typically end in either a climax or a rollover.
Principais conclusões:
- Market Phases: Understanding the alternating phases of market expansion and contraction.
- Trend Continuation: Recognizing that trends are more likely to continue than reverse.
- Momentum and Price: Momentum often leads price movements in the market.
- Trend Termination: Trends usually conclude with a climax or a gradual rollover.
Aplicativo: Traders can use these principles to better understand market behavior and to develop more effective trading strategies. Recognizing these patterns can aid in making informed decisions about entry and exit points in the market.

Figura title: Essential Elements of Technical Analysis
Fonte: Original Finance Paisa
Descrição: The infographic provides a concise overview of key aspects of technical analysis in trading. It covers essential topics such as Price Action, Chart Patterns, Indicators, Trading Trends, and Entry & Exit strategies. Each element is crucial for understanding and interpreting market movements and making informed trading decisions.
Principais conclusões:
- Price Action: Focuses on the movement of prices to make trading decisions.
- Chart Patterns: Identifies common patterns in price charts that signal future market movements.
- Indicators: Uses mathematical calculations based on historical price, volume, or open interest information.
- Trading Trends: Understanding market trends is vital for determining the direction of trades.
- Entry & Exit Strategies: Essential for maximizing gains and minimizing losses.
Aplicativo: Traders can apply these technical analysis elements to develop a comprehensive trading strategy. Understanding these concepts is key for both novice and experienced traders to navigate the markets effectively.
Summary
In this opening chapter, we have dipped our toes into the basics of Technical Analysis. We’ve looked into its history, how it contrasts with fundamental analysis, the principles it operates on, and its role in the realm of financial markets. As we proceed, we’ll delve deeper into these elements, arming you with the necessary skills to analyze and predict market trends.
Learning Technical Analysis is akin to deciphering a map. At first glance, it may seem overwhelming, but as you become familiar with the symbols and patterns, it evolves into a potent tool guiding you through the financial landscape. Let’s set sail on this exhilarating voyage!
Informações importantes da lição:
Declaração de Encerramento: The exploration of Technical and Fundamental Analysis within this chapter arms you with a multifaceted understanding of market evaluation. This knowledge blends the precision of Technical Analysis with the depth of Fundamental Analysis, enriching your trading and investment decisions. Armed with a strong foundation in the principles that guide market movements and an appreciation for the significance of historical market data, you are now adept at identifying opportunities and mitigating risks in the financial markets. This empowers you to make informed decisions, utilizing a blend of analytical techniques to accurately forecast future price movements and navigate the complexities of trading and investing with confidence and strategic foresight.
- Technical and Fundamental Analysis provide comprehensive market evaluation: They offer unique perspectives on price movements, combining pattern recognition with insights into a company’s intrinsic value.
- Historical market data is key in forecasting price movements: Understanding the significance of price trends and patterns aids in strategic trade planning.
- Digital advancements and key indicators enhance analysis: Familiarity with real-time data, digital charts, and tools like trend lines improves analysis efficiency and effectiveness.
- A nuanced understanding of market analysis techniques: This knowledge sets the stage for advanced exploration and application in market predictions and trading strategies.

