
Global: Introdução aos Ciclos de Negócios e Classes de Ativos
Objetivos de aprendizagem da lição:
- Understand the global business cycle: Learn how international factors such as trade flows e commodity prices influence the global business cycle and its phases.
- Identify impacts on various asset classes: Gain insights into how stocks, bonds, cash, real estate, e commodities react differently during each phase of the global business cycle.
- Analyze the influence of central banks: Explore how policies from central banks around the world, like the Reserva Federal e o BCE, affect global markets and asset performances.
- Apply global market strategies: Develop strategies to optimize investment portfolios by understanding and leveraging the effects of global economic activities on asset classes.
A. Introduction to Business Cycles and Asset Classes
Globally, the business cycle follows similar stages, but international factors such as global interest rates, trade flows, e commodity prices also play a critical role. The performance of asset classes—stocks, bonds, cash, real estate, e commodities—varies depending on these phases and regional economic conditions. Investors need to consider how global factors like central bank policies and international trade influence these asset classes.
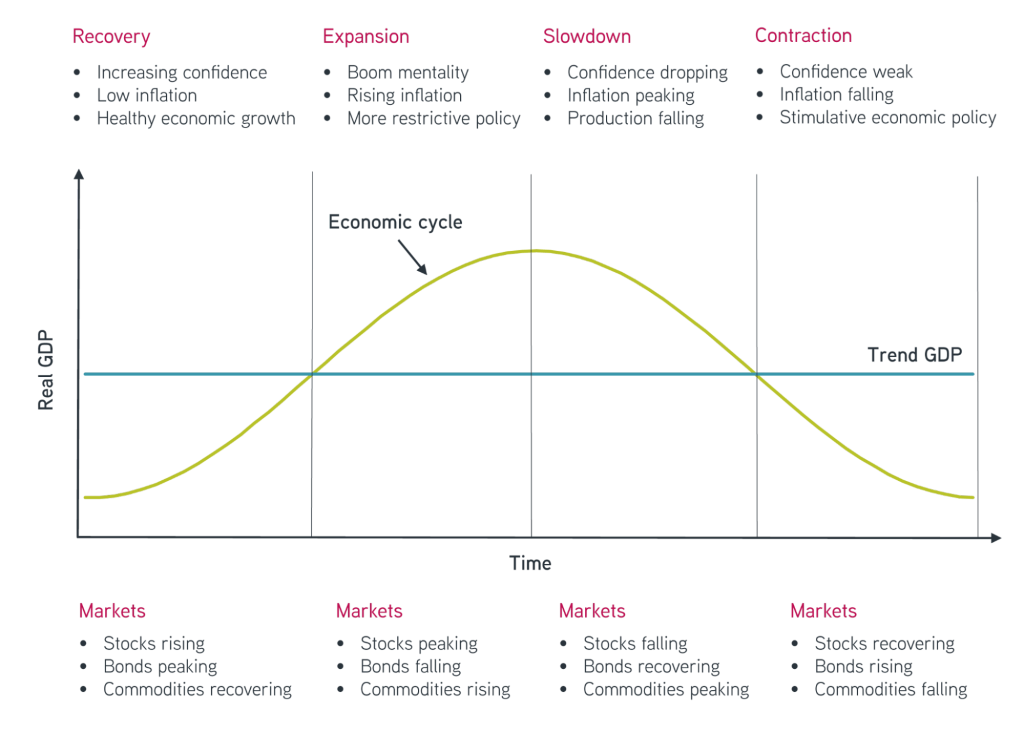
Figura: Economic Cycle and Market Performance
Descrição:
The figure illustrates the economic cycle and its four phases: Recovery, Expansion, Slowdown, and Contraction. It highlights how real GDP fluctuates over time, showing the relationship between economic activity and market behavior. During each phase, different asset classes—stocks, bonds, and commodities—react in varying ways, reflecting market trends in response to economic changes.
Principais conclusões:
- Recovery is characterized by rising confidence, low inflation, and healthy growth, with stocks and bonds generally increasing.
- Expansion indicates a boom mentality, rising inflation, and restrictive policies, often leading to stocks peaking and bonds falling.
- Slowdown shows confidence dropping, inflation peaking, and production falling, causing stocks to fall and bonds to recover.
- Contraction involves weak confidence, falling inflation, and stimulative policies, with stocks declining and bonds rising.
Aplicação da Informação:
Compreendendo o economic cycle helps investors anticipate market behavior and adjust their strategies accordingly. By knowing which assets perform best during each phase, investors can optimize their portfolios to align with economic conditions, improving potential returns and managing risks.
B. Stocks, Bonds, and Cash: A Primer
Globally, these three asset classes respond differently across business cycles:
- Ações: Stock performance is typically strong during expansion phases, with technology e consumer discretionary sectors driving growth. However, global stocks are volatile during contractions.
- Títulos: Government bonds, especially U.S. Treasuries, provide safety during recessions, while high-yield corporate bonds perform better during expansions as credit risks decrease.
- Cash: Cash becomes an attractive asset in global markets during recessions when investors seek safety and liquidity amid uncertainty in stocks and bonds.
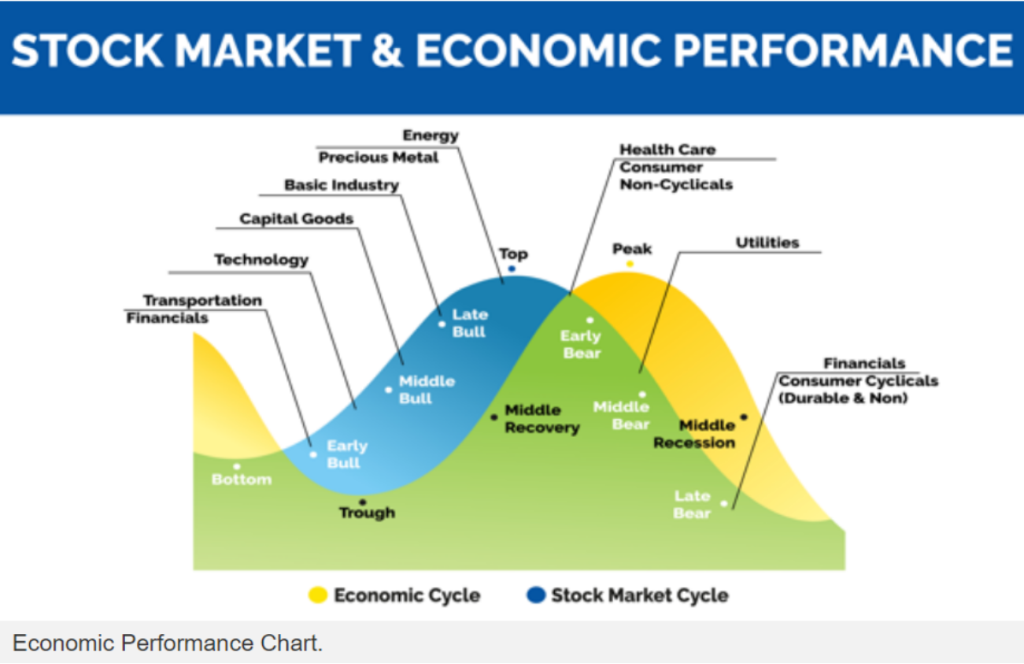
Figura: Stock Market & Economic Performance
Descrição:
The figure illustrates the relationship between the economic cycle e o stock market cycle. It depicts the different stages of each cycle, including phases like Early Bull, Middle Bull, Late Bull, Early Bear, e Middle Recession. Key sectors such as Energy, Utilities, e Health Care are aligned with specific phases, indicating their performance during economic transitions.
Principais conclusões:
- O economic cycle e stock market cycle have distinct but interconnected phases.
- Sectors like Transportation e Financials perform well in the early bull phase, while Utilities excel at the peak.
- Basic industries e capital goods perform better in the middle bull phase, aligning with economic recovery.
- Precious metals e energy typically peak during the late bull phase.
- Health Care e Consumer Non-Cyclicals offer stability during recessions.
Aplicação da Informação:
Understanding the correlation between the economic cycle e stock market performance can help investors make informed decisions about sector allocation based on economic phases. By aligning investments with phases like recovery ou recession, users can optimize returns and manage risk effectively. This approach aids in strategic portfolio diversification across economic conditions.
C. Early Expansion Phase
In global markets, the early expansion phase is marked by recovery from recession:
- Ações: Global stocks surge, with companies in mercados emergentes often leading the way as they experience rapid recovery.
- Títulos: High-yield bonds perform well globally as investors regain confidence and seek higher returns.
- Cash: Cash positions are reduced as investors move into riskier assets for growth.
D. Mid Expansion Phase
Globally, mid expansion sees more stable but slower growth:
- Ações: Global equity markets continue to perform well, but the focus shifts to industrial e financial sectors as growth moderates.
- Títulos: Bond performance weakens, especially government bonds, as interest rates rise globally.
- Cash: Cash positions remain low as growth expectations persist.
E. Late Expansion Phase
Globally, the late expansion phase is characterized by high volatility:
- Ações: Investors shift to defensive sectors globally, such as consumer staples e healthcare.
- Títulos: Safe-haven bonds, like U.S. Treasuries, gain popularity as inflation pressures mount.
- Cash: Cash and equivalents become more desirable as recession fears grow.
F. Recession
Globally, recessions impact all asset classes:
- Ações: Global stock markets decline, with mercados emergentes often suffering the most severe losses.
- Títulos: Government bonds provide a safe haven, while corporate bonds face risks of default.
- Cash: Cash is highly favored as it protects against further losses.
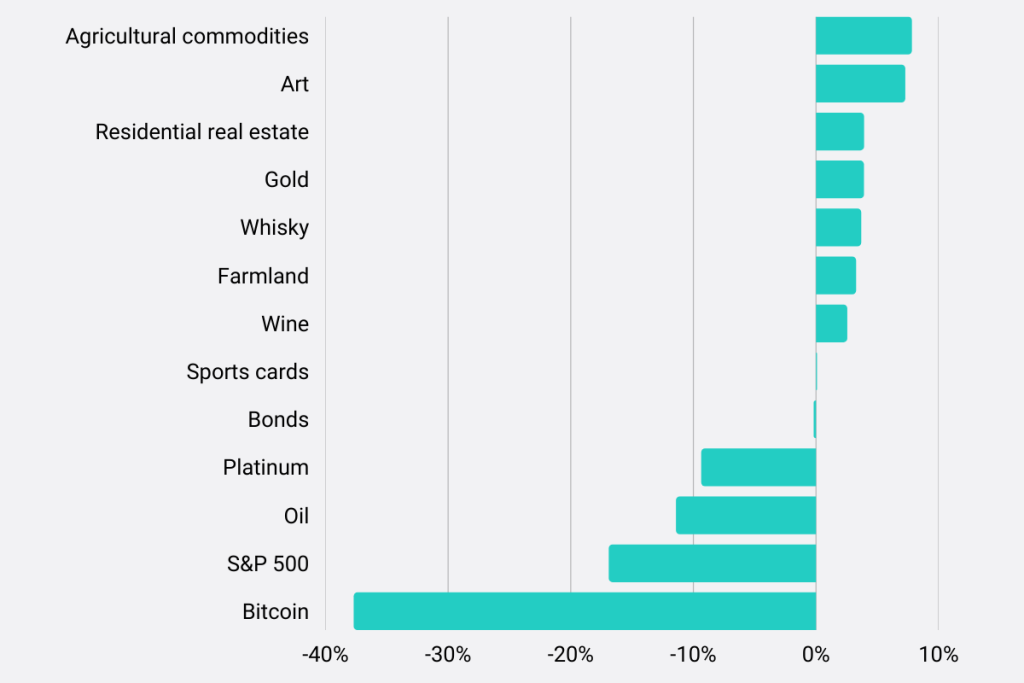
Figura: Top Performing Asset Classes During a Recession
Descrição:
The figure compares the performance of various asset classes during a recession, showing their average return percentages. Asset classes include agricultural commodities, art, residential real estate, gold, whisky, farmland, wine, sports cards, bonds, platinum, oil, S&P 500, e Bitcoin. The chart reveals that while some assets have positive returns during economic downturns, others experience negative returns, with Bitcoin showing the largest decline.
Principais conclusões:
- Agricultural commodities, art, e residential real estate have positive returns during recessions.
- Gold, whisky, e farmland also maintain a positive return trend, indicating resilience in uncertain times.
- Bitcoin, S&P 500, e oil are among the worst performers, showing negative returns during recessions.
- The data suggests that tangible assets como farmland e commodities may offer better stability during economic downturns.
Aplicação da Informação:
Understanding which asset classes perform well during recessions can help investors diversify their portfolios. By including more recession-resistant assets, investors can minimize potential losses and enhance portfolio stability in turbulent economic times.
G. Real Estate and Commodities: An Overview
Globally, real estate and commodities follow similar trends, but with additional factors like global demand e geopolitical tensions affecting performance:
- Imobiliária: Global real estate markets thrive in early and mid-expansion phases, driven by low interest rates and rising demand.
- Commodities: Commodities like oil e metals perform well during global expansions, while gold is a safe-haven asset during recessions.
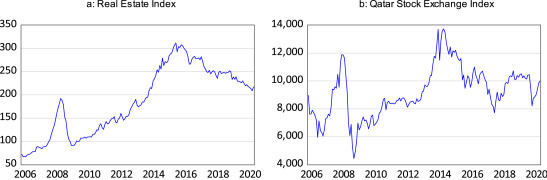
Figura: Real Estate Index vs. Qatar Stock Exchange Index
Descrição:
The figure consists of two line charts that depict the performance of the Real Estate Index (left) and the Qatar Stock Exchange Index (right) from 2006 to 2020. The Real Estate Index shows a steady rise until 2015, after which it experiences a decline. The Qatar Stock Exchange Index demonstrates a more volatile pattern, with significant peaks and troughs over the same period, indicating fluctuations in the stock market.
Principais conclusões:
- O Real Estate Index showed consistent growth until 2015 but began declining afterward, reflecting potential changes in the real estate market.
- O Qatar Stock Exchange Index experienced more volatility, with sharp rises and falls, indicating higher sensitivity to market conditions and economic events.
- Real estate appears to have had more stable growth compared to the mercado de ações, although both indexes experienced downturns after 2015.
Aplicação da Informação:
Investors can use these charts to understand the historical performance of real estate versus the mercado de ações in Qatar. The data can help inform decisions about portfolio diversification, especially in contexts where market volatility is a concern. It also highlights the potential benefits of including real estate as a stabilizing asset in a broader investment strategy.
H. Real Estate Across Business Cycle Stages
- Early Expansion: Global real estate markets recover as economic growth resumes.
- Mid Expansion: Strong performance, especially in mercados emergentes, where urbanization drives demand.
- Late Expansion: Real estate becomes riskier as borrowing costs rise.
- Recession: Property values fall as demand decreases and financing becomes harder to obtain.
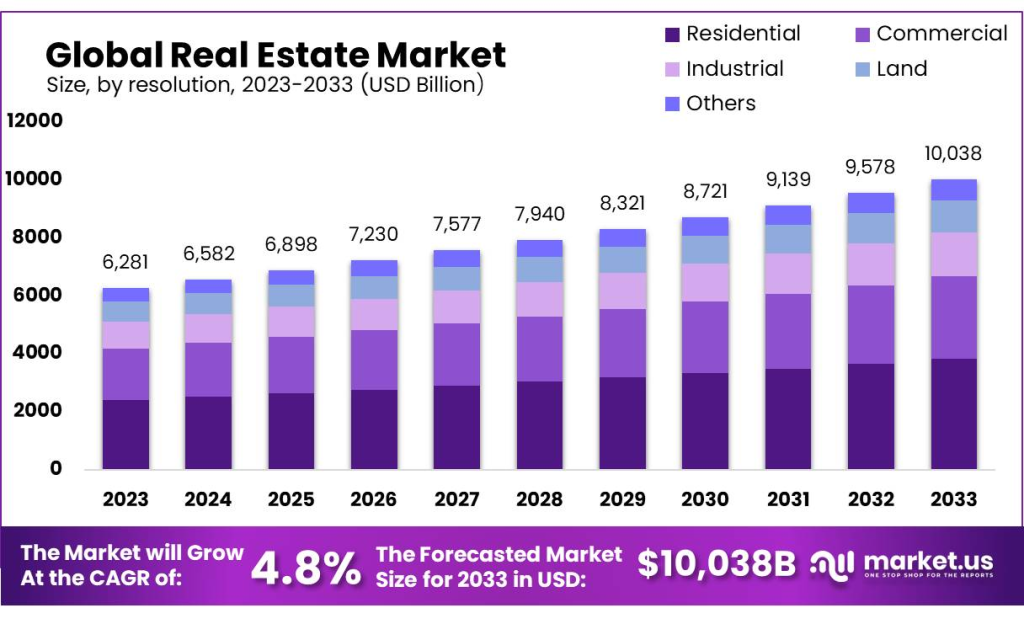
Figura: Global Real Estate Market: Size, by Resolution, 2023-2033 (USD Billion)
Descrição:
The stacked bar chart represents the projected size of the global real estate market from 2023 to 2033, categorized by different sectors: Residential, Commercial, Industrial, Land, and Others. The market shows consistent growth over the years, increasing from $6,281 billion in 2023 to a forecasted size of $10,038 billion in 2033. The chart also highlights a Compound Annual Growth Rate (CAGR) of 4.8% over the forecast period.
Principais conclusões:
- O global real estate market is projected to grow steadily from 2023 to 2033, reaching $10,038 billion.
- O residential sector consistently holds the largest share, followed by commercial e industrial sectors.
- The market’s CAGR is anticipated to be 4.8% over the forecast period, indicating stable growth.
- The sectoral distribution remains relatively consistent throughout the years, suggesting balanced growth across different real estate sectors.
Aplicação da Informação:
This data helps investors understand the growth potential in the global real estate market. It emphasizes the importance of diversifying investments across different real estate sectors, considering the consistent growth forecasted. Real estate investors can use this projection to plan long-term strategies, targeting sectors like residential e commercial, which hold significant shares of the overall market.
I. Commodities Across Business Cycle Stages
- Early Expansion: Commodities start to recover, driven by rising global demand for raw materials.
- Mid Expansion: Commodities benefit from increasing industrial and consumer demand.
- Late Expansion: Commodities like gold become attractive due to rising inflation and uncertainty.
- Recession: Commodity prices, except for gold, typically decline as global demand weaken
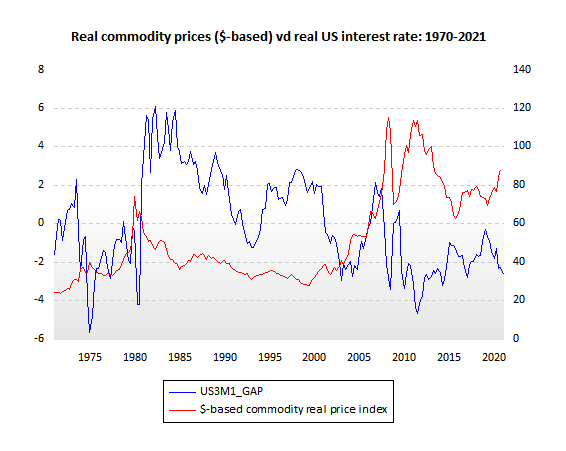
Figura: Real Commodity Prices (USD-based) vs. Real US Interest Rate: 1970-2021
Descrição:
The chart illustrates the relationship between real commodity prices (USD-based, in red) and the real US interest rate (in blue) over the period from 1970 to 2021. The red line represents the commodity real price index, while the blue line shows the US3M1_GAP, which reflects the real US interest rate. The two variables often move in opposite directions, demonstrating an inverse relationship between commodity prices and real interest rates over time.
Principais conclusões:
- Real commodity prices e real US interest rates tend to move inversely, suggesting that when interest rates increase, commodity prices often decrease, and vice versa.
- Periods of high real interest rates, such as during the early 1980s and early 2000s, correspond with lower commodity prices.
- Conversely, lower real interest rates, such as in the mid-1970s and early 2010s, often coincide with higher commodity prices.
- This relationship highlights the impact of monetary policy on commodity markets, making it crucial for investors to consider interest rate trends when analyzing commodity prices.
Aplicação da Informação:
Compreendendo o inverse relationship between real commodity prices e real interest rates is critical for commodity investors and traders. This chart demonstrates how shifts in monetary policy can affect commodity prices, enabling investors to anticipate price movements based on changes in interest rates. For example, a declining interest rate environment may signal potential upward movement in commodity prices, offering insights for strategic investment decisions in commodity markets.
Conclusão
Understanding how asset classes perform across different stages of the business cycle is essential for investors looking to maximize returns and minimize risks. Whether focusing on local European markets or global trends, aligning investment strategies with the business cycle allows for better portfolio management and informed decision-making. Diversification across stocks, bonds, cash, real estate, e commodities helps investors manage risk throughout the different phases of the business cycle. By recognizing how each asset class responds to economic conditions, investors can make more informed decisions, positioning themselves to take advantage of opportunities in expansion phases and protecting their portfolios during contractions and recessions.
Informações importantes da lição:
- Business cycles are globally interconnected: Recognize how phases like recovery e contraction in the global business cycle affect asset classes differently, influencing investment decisions.
- Central bank policies are pivotal: Policies set by central banks significantly impact global asset classes, highlighting the importance of staying informed on global economic policies.
- Diversification on a global scale is beneficial: Diversifying investments across various global asset classes can help mitigate risks and exploit growth opportunities during different economic phases.
- Strategic asset allocation is key: Aligning investment choices with the stages of the global business cycle can lead to optimized portfolio performance and better risk management.
Declaração de Encerramento:
Understanding the complexities of the global business cycle and its impact on various asset classes is crucial for investors to make informed decisions, enhancing their ability to manage risks and capitalize on opportunities in the international market.
