
Lokalnie: czynniki makroekonomiczne i cykl koniunkturalny
Cele lekcji:
- Wstęp: Understand the mechanics of the stock market and how it operates through stock exchanges I over-the-counter (OTC) markets. This foundation is crucial for anyone entering the finance field or investing in the stock market.
- Learn about the roles and differences between derivatives markets, including exchange-traded I OTC derivatives, and their implications in the financial landscape. This knowledge is essential for managing financial risks and making informed investment decisions.
- Grasp the concept of fractional ownership in stocks and how it democratizes investment in large corporations, allowing investors to participate in the economic benefits of companies without large capital outlays.
- Deepen understanding of market dynamics, specifically the forces of supply and demand that drive stock prices, including how external factors such as economic indicators and corporate performance influence these dynamics.
4.1 Macroeconomic Factors and the Business Cycle
In Europe, macroeconomic factors significantly influence the stock market and the broader business cycle. One of the primary drivers is the European Central Bank (ECB), which controls monetary policy in the Eurozone. The ECB’s tools include adjusting stopy procentowe (the cost of borrowing money) and engaging in quantitative easing (QE) (injecting money into the economy to encourage investment). When the ECB lowers interest rates, borrowing becomes more affordable for businesses and consumers, which often leads to increased spending and investment, boosting the stock market. Conversely, higher interest rates can slow economic activity, which might lead to a decline in stock prices.
Another major factor is Brexit, which introduced significant economic uncertainty for both the UK and the broader European market. Since leaving the European Union, the UK has had to establish its own trade deals and regulations, impacting supply chains, trade policies, and investor confidence. The separation has created new complexities for businesses and investors trading between the UK and the EU, contributing to fluctuations in stock prices.

Niemcy also plays a key role in shaping the European business cycle, as it is the largest economy in Europe. When Germany’s economy grows, it often has a positive effect on the Eurozone as a whole, driving up stock prices across the region. On the other hand, when Germany faces economic challenges, such as a decline in exports, the impact is felt across the Eurozone, often leading to a slowdown in economic growth and stock market performance.
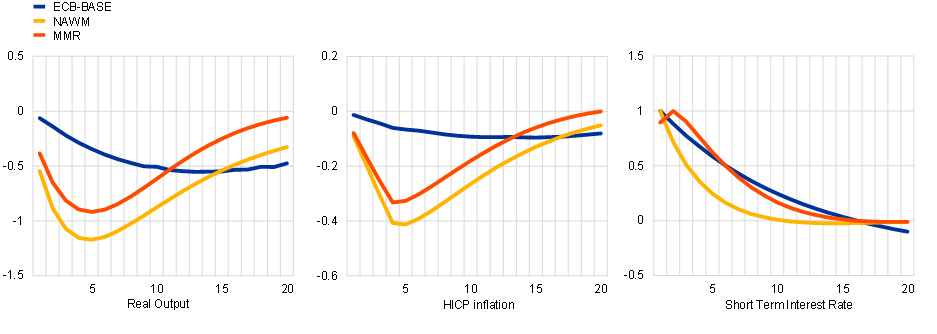
Postać: GDP Growth Rate Forecasts for Eurozone, USA, and Japan
Opis:
The graph shows the GDP growth rate forecasts for the Eurozone, USA, and Japan over time. The three separate panels illustrate the growth projections for these regions, represented by three different lines: Eurozone (blue), USA (red), I Japan (yellow). The Y-axis shows the percentage change in GDP, while the X-axis represents the timeline. The graph highlights differences in the expected economic recovery paths of these major economies, with the USA generally showing stronger growth compared to the Eurozone and Japan.
Najważniejsze wnioski:
- USA is projected to have a higher GDP growth rate compared to the Eurozone I Japan.
- Eurozone shows a gradual but steady recovery over time.
- Japan has the lowest growth forecast among the three, indicating a slower economic recovery.
- The graph emphasizes differences in economic recovery trends across these regions.
Zastosowanie informacji:
Investors can use these GDP growth rate forecasts to identify potential investment opportunities in different regions. By understanding economic recovery trends, investors can assess the economic outlook of each region, aiding in dywersyfikacja portfela. These projections are useful for making informed decisions regarding investments in equities, bonds, and other financial assets linked to economic growth.
4.2 Ten Essential Macroeconomic Terms
Understanding macroeconomic terms is essential for navigating stock markets, and differences between the Eurozone and non-Eurozone countries can impact how these terms are applied. Below are explanations of ten important macroeconomic terms and how they vary across regions:
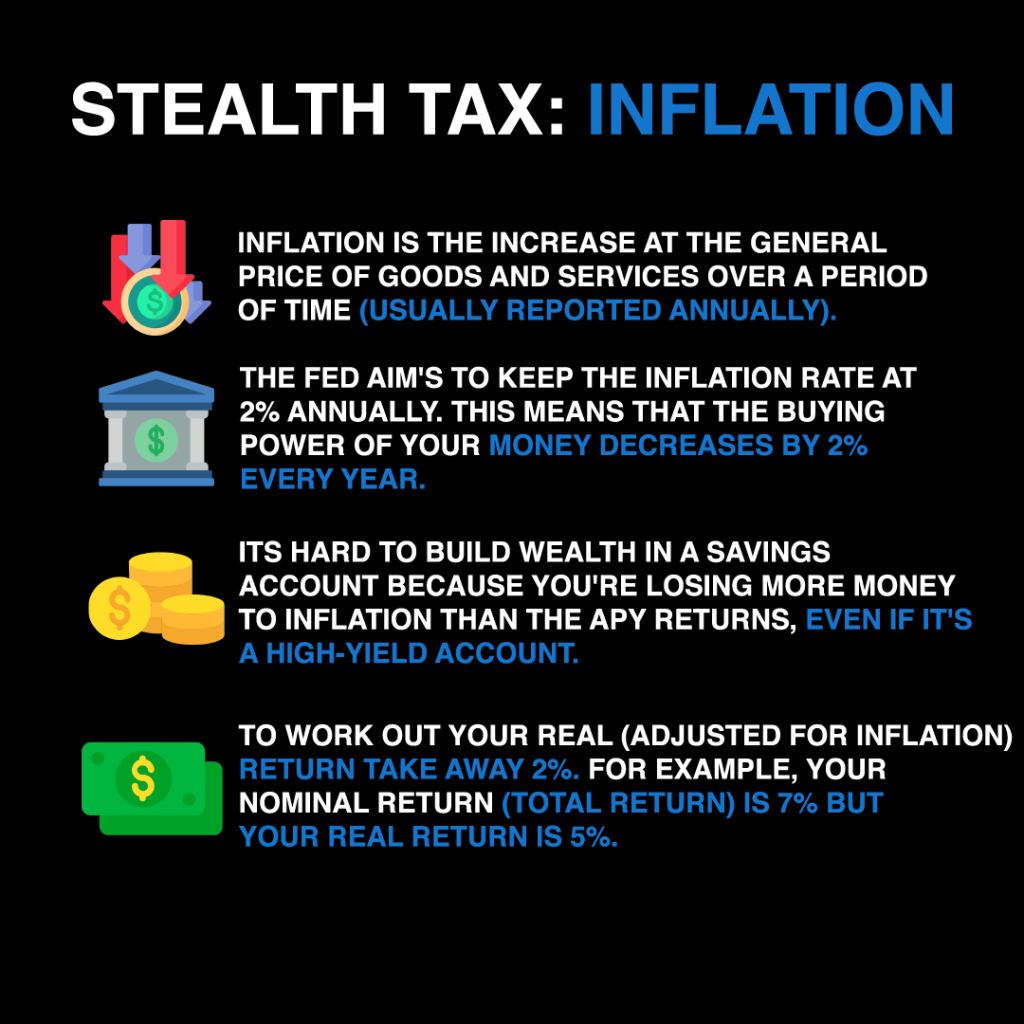
- Inflation: Inflation refers to the increase in prices over time, reducing the purchasing power of money. In the Eurozone, the ECB targets an inflation rate of around 2%, using monetary policy to keep prices stable. In non-Eurozone countries, such as the UK, inflation is managed by their central banks, like the Bank of England. High inflation can lead to higher interest rates, which typically lower stock prices as borrowing becomes more expensive.
- Interest Rates: Interest rates are the cost of borrowing money and the return on savings. The ECB sets a single interest rate for all Eurozone countries, affecting everything from mortgages to business loans. In non-Eurozone countries, central banks set their own interest rates. Higher interest rates can reduce borrowing and investment, while lower rates can stimulate economic activity and drive up stock prices.
- Gross Domestic Product (GDP): GDP measures the total economic output of a country, including goods and services produced. In the Eurozone, GDP growth is often driven by larger economies like Germany and France, while non-Eurozone countries, such as Switzerland, rely more on exports and financial services for GDP growth. A rising GDP indicates a growing economy, which is generally positive for stock markets.
- Stopa bezrobocia: The unemployment rate shows the percentage of the workforce that is not employed but is actively seeking work. In Eurozone countries, unemployment rates are influenced by EU-wide policies, such as labor mobility, which allows workers to move freely between countries. In non-Eurozone countries, governments have more flexibility in creating labor policies. A falling unemployment rate can signal economic growth, which can boost investor confidence and stock prices.
- Fiscal Policy: Fiscal policy refers to how governments use taxation and spending to influence the economy. In the Eurozone, countries must adhere to the Stability and Growth Pact (SGP), which limits how much they can borrow and spend. In non-Eurozone countries, governments have more freedom to implement fiscal policies tailored to their needs, especially during economic downturns. Expansionary fiscal policies (increased spending or tax cuts) can boost economic growth and stock market performance, while contractionary policies may slow growth.
- Trade Balance: The trade balance measures the difference between a country’s exports and imports. Eurozone countries benefit from tariff-free trade within the European Single Market, making it easier to export goods to other EU countries. Non-Eurozone countries, such as the UK, must negotiate their own trade agreements, which can introduce tariffs and affect the balance of trade. A positive trade balance (more exports than imports) can strengthen a country’s economy and boost stock prices.
- Currency Exchange Rates: In the Eurozone, countries share the euro (EUR), making trade and investment within the region more straightforward. Non-Eurozone countries, like Denmark or the UK, maintain their own currencies, such as the British pound or the Danish krone. Currency fluctuations can affect the price of imports and exports, as well as stock market performance. For instance, a stronger euro can make European exports more expensive and less competitive globally.
- Quantitative Easing (QE): QE is a policy used by central banks to inject money into the economy by purchasing government bonds or other financial assets. The ECB has used QE to stimulate the economy during downturns. Non-Eurozone countries, such as the UK and Japan, have also implemented QE programs. QE generally leads to lower interest rates, encouraging borrowing and investment, which can boost stock market performance.
- Public Debt: Public debt refers to the amount of money a government owes. In the Eurozone, countries are required to keep public debt within limits set by the European Commission, under the Stability and Growth Pact. Non-Eurozone countries set their own public debt policies, allowing for more flexibility during economic crises. High public debt can lead to higher interest rates, which may reduce investor confidence and negatively impact stock prices.
- Consumer Confidence: Consumer confidence measures how optimistic people are about the economy and their financial situation. In the Eurozone, consumer confidence is influenced by both EU-wide and national policies, while in non-Eurozone countries, domestic political and economic conditions play a more significant role. High consumer confidence can lead to increased spending, which stimulates the economy and can lead to higher stock prices.
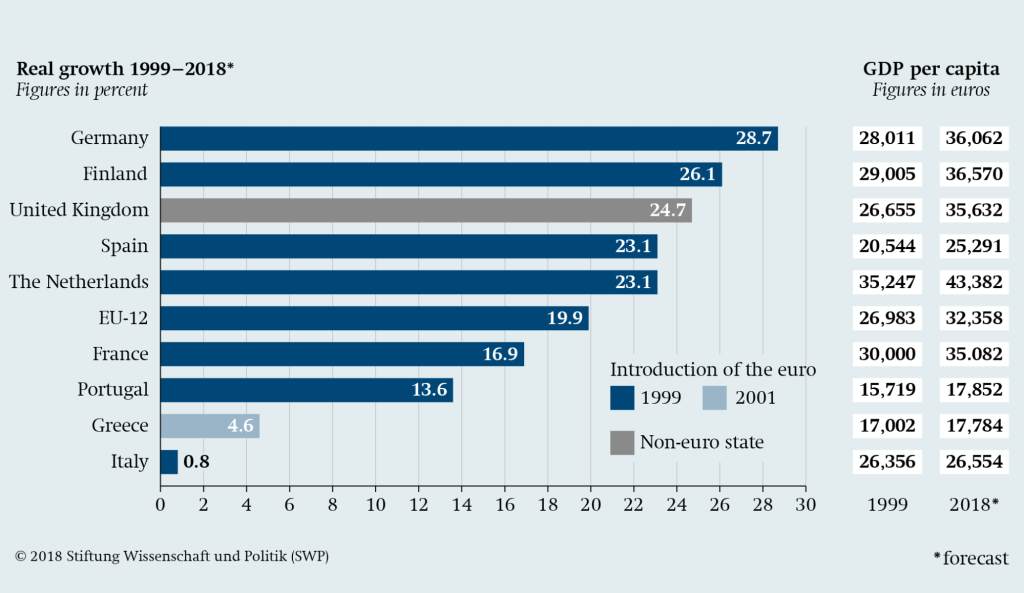
Postać: Real Growth and GDP Per Capita in European Countries (1999–2018)
Opis:
This bar chart illustrates real economic growth rates from 1999 to 2018 in several European countries, measured as a percentage change. It highlights the highest growth in Germany (28.7%), followed by Finland (26.1%), and the United Kingdom (24.7%). Additionally, it shows GDP per capita for each country in 1999 and 2018, providing insight into economic development over time. The chart also notes the year of euro adoption, distinguishing between 1999 adopters, 2001 adopters, and non-euro states.
Najważniejsze wnioski:
- Niemcy experienced the highest economic growth among the listed countries, while Włochy had the lowest growth rate (0.8%).
- Eurozone adopters generally showed significant economic growth compared to non-euro states.
- GDP per capita improved across all countries from 1999 to 2018, indicating overall economic progress.
- Countries that adopted the euro earlier showed diverse growth rates, suggesting factors beyond euro adoption influencing growth.
Zastosowanie informacji:
This data is useful for analyzing the impact of euro adoption on economic growth and comparing the economic performance of euro and non-euro states. Investors and analysts can use this information to understand macroeconomic trends and assess the long-term growth potential of European markets. It also helps in evaluating how currency policy can influence economic outcomes.
4.3 Comparing Germany and Italy
When comparing two European countries like Niemcy I Włochy, key macroeconomic terms highlight significant differences in their economies.
- PKB: Germany, as the largest economy in Europe, has a higher Gross Domestic Product (GDP) than Italy. Germany’s GDP is driven by its strong manufacturing and export sectors, particularly in automotive and machinery. Italy, on the other hand, has a more diversified economy with a larger focus on tourism and small-to-medium enterprises.
- Stopa bezrobocia: Germany tends to have lower unemployment rates compared to Italy, due in part to its strong industrial base and vocational training system. Italy’s unemployment rate is typically higher, especially in the southern regions, which can lead to slower economic growth.
3. Inflation: Both countries share similar inflation targets under the European Central Bank (ECB), but inflationary pressures can vary. Germany may face higher inflation due to wage growth and consumer spending, while Italy’s inflation may be more subdued due to weaker domestic demand.
4. Public Debt: Italy has a significantly higher public debt-to-GDP ratio compared to Germany. While Germany’s fiscal policies emphasize budget surpluses, Italy has struggled with higher levels of debt, which impacts its borrowing costs and economic stability.

Postać: Macroeconomic Key Indicators of Selected Euro Area Countries
Opis:
This table presents several macroeconomic indicators for selected Euro area countries in late 2021, including monthly inflation rates (from October to December), annual real GDP changes from 2020 to 2022, unemployment rates for December 2021, and government debt-to-GDP ratios for 2021. The data shows variations in inflation rates, economic growth recovery, unemployment levels, and debt burdens across different countries, providing a snapshot of the economic environment in the Eurozone.
Najważniejsze wnioski:
- Inflation: Steady rise observed across countries, with Hiszpania having the highest rate at 6.6% in December 2021.
- Real GDP Growth: Varies from country to country, with most showing positive growth in 2021 following a downturn in 2020 due to the pandemic.
- Unemployment: Highest in Greece at 12.7% and lowest in The Netherlands at 3.8%.
- Debt Levels: Greece has the highest government debt-to-GDP ratio (206.7%), while The Netherlands has the lowest (58.1%).
Zastosowanie informacji:
This data helps users evaluate the macroeconomic health of Eurozone countries, aiding in identifying trends in inflation, wzrost gospodarczy, I debt management. Investors can use this information to understand the economic conditions of specific countries, assess potential risks I opportunities, and make informed decisions regarding inwestycje Lub policy analysis in the Euro area.
4.4 Macroeconomic Terms and Their Impact on Sectors and Industries
- Niemcy: Germany’s industrial sector, particularly automotive manufacturing, is highly sensitive to changes in stopy procentowe I exchange rates. Low interest rates encourage investment in manufacturing, while a strong euro can make exports more expensive.
- Francja: France’s agricultural sector relies heavily on government subsidies I trade balances within the EU. Changes in fiscal policy or EU trade agreements can significantly impact agricultural output and pricing.
- Włochy: Tourism, a major industry in Italy, is affected by consumer confidence I inflation. Higher inflation can reduce disposable income, leading to lower tourism revenue.
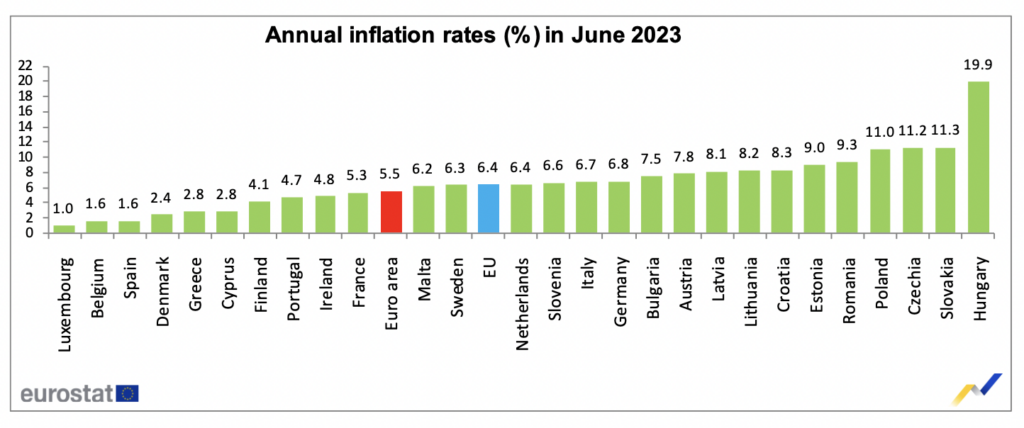
Postać: Annual Inflation Rates (%) in June 2023
Opis:
The bar chart illustrates the annual inflation rates across different European Union countries for June 2023. It shows how inflation varies significantly among these countries, with Hungary experiencing the highest rate at 19.9%, chwila Luxembourg has the lowest at 1.0%. The Euro area inflation rate stands at 5.5%, slightly below the EU average of 6.4%.
Najważniejsze wnioski:
- Hungary leads with the highest inflation rate in the EU at 19.9%.
- Luxembourg reports the lowest inflation rate at 1.0%.
- Ten Euro area I EU average inflation rates are 5.5% I 6.4%, respectively.
- There is a clear disparity in inflation rates across the EU, indicating varied economic pressures.
Zastosowanie informacji:
This data helps users understand the current inflation trends in Europe, highlighting countries with more significant price pressures. Investors can use this information to assess stabilność gospodarcza, investment risks, and potential możliwości rynkowe within these countries.
4.5 Top 10 Economic Indicators
- Eurozone GDP: Measures the total economic output of the Eurozone countries.
- Harmonized Index of Consumer Prices (HICP): The main measure of inflation used by the ECB.
- Eurozone Unemployment Rate: A key indicator of labor market health.
- ECB Interest Rates: Reflect the cost of borrowing across the Eurozone.
- Euro Exchange Rate: Impacts trade competitiveness.
- Purchasing Managers’ Index (PMI): Gauges the health of the manufacturing sector.
- EU Retail Sales: Indicator of consumer spending patterns.
- Government Debt-to-GDP Ratio: Measures the sustainability of fiscal policies.
- Consumer Confidence Index: Shows how optimistic consumers are about the economy.
- Trade Balance: Reflects the difference between exports and imports within the Eurozone.
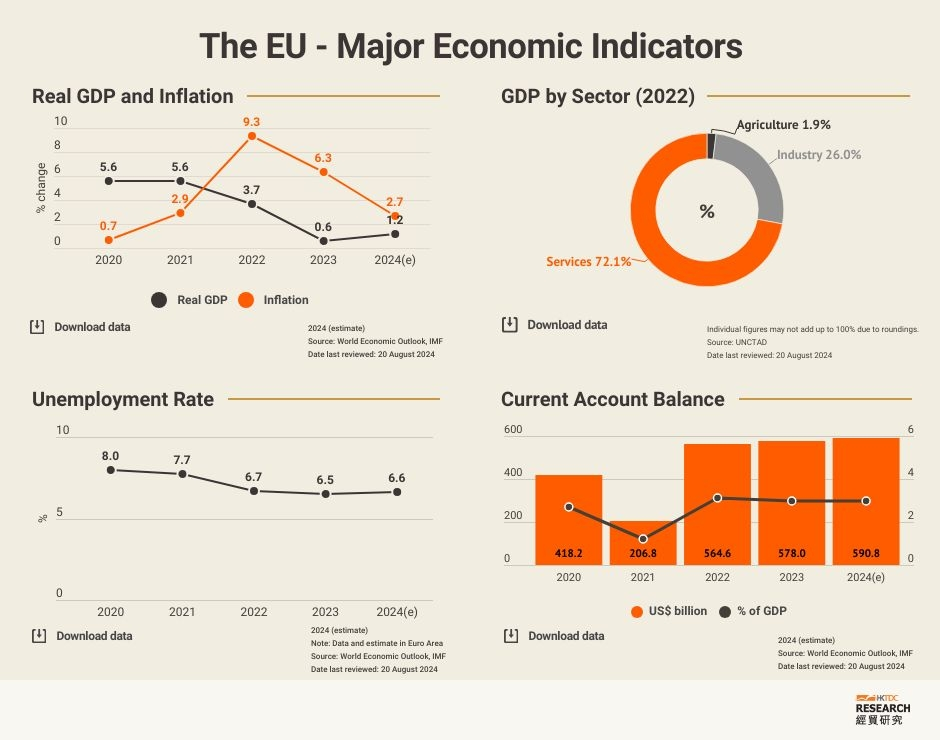
Postać: The EU – Major Economic Indicators
Opis:
This image presents major economic indicators for the European Union from 2020 to 2024. It includes real GDP and inflation rates, GDP distribution by sector, unemployment rate, I current account balance. The GDP distribution for 2022 shows that services constitute 72.1%, chwila industry I rolnictwo make up 26.0% I 1.9%, respectively. The unemployment rate trends downward from 8.0% in 2020 to an estimated 6.6% in 2024, while current account balance fluctuates, peaking at 590.8 billion USD in 2024.
Najważniejsze wnioski:
- Real GDP growth peaked at 5.6% in 2021 but is estimated to slow to 1.2% by 2024.
- Inflation hit its highest level at 9.3% in 2022, projected to decrease to 2.7% in 2024.
- Services sector is the largest contributor to GDP at 72.1%.
- Unemployment rate has been gradually decreasing, showing signs of labor market recovery.
- Current account balance shows a positive trend, reflecting a steady surplus over the years.
Zastosowanie informacji:
Understanding these indicators helps users analyze the EU’s economic health, observe trends in inflation, employment, I sectoral contributions to GDP. Such insights are crucial for making informed decisions in investing, policy-making, or evaluating the stabilność gospodarcza of the region.
4.6 Monetary and Fiscal Policy
Monetary Policy: In Europe, monetary policy is controlled by the ECB, which sets interest rates for all Eurozone countries. The ECB also uses tools like quantitative easing to control inflation and stabilize the economy.
Fiscal Policy: European governments follow the Stability and Growth Pact, which limits deficits and public debt levels. Countries like Niemcy often implement more conservative fiscal policies, while others, like Włochy, tend to push for more flexibility.
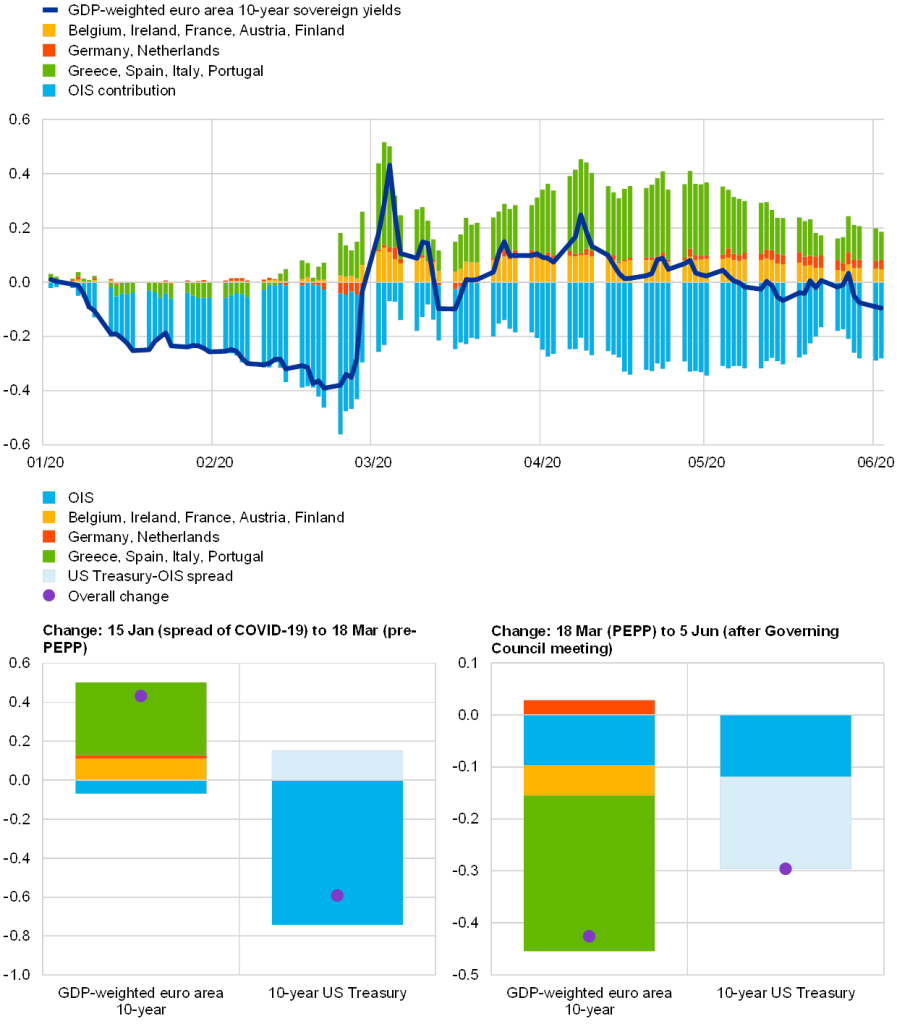
Postać: Euro Area Macroeconomic Overview
Opis:
This image provides a detailed look at various macroeconomic indicators for the Euro Area over time, including contributions to GDP growth, price changes, and other economic components. The top graph shows a time series of GDP components such as private consumption, investment, net exports, I government spending. The bottom left graph visualizes changes in PKB I price levels for specific periods, while the bottom right graph compares projections versus actual performance. The data highlights fluctuations, especially during significant economic events.
Najważniejsze wnioski:
- Private consumption I government spending play major roles in GDP changes.
- Net exports fluctuate significantly, indicating sensitivity to global demand.
- Ten bottom charts show disparities between projected and actual outcomes, emphasizing volatility.
- Economic downturns, like those in early 2020, show visible impacts across all components.
Zastosowanie informacji:
This data is useful for understanding economic health and analyzing the impact of different components on overall growth. Investors can use it to evaluate the resilience of economies, make informed decisions about sectors, and anticipate potential market reactions to macroeconomic events.
4.7 Business Cycle Phases and Macroeconomic Indicators
Ten European business cycle, like the global cycle, goes through the standard phases of ekspansja, szczyt, skurcz, I trough. However, specific macroeconomic factors unique to the European context, particularly the policies of the European Central Bank (ECB) and the interconnected nature of the Eurozone economies, cause these phases to manifest differently across EU countries.
- Faza ekspansji: During the expansion phase, the European economy experiences growth, characterized by rising PKB, increased employment, and consumer spending. ECB interest rates typically remain low in this phase to encourage borrowing and investment. For instance, after the 2008 financial crisis, the ECB implemented a prolonged period of low interest rates and quantitative easing to stimulate economic activity, which resulted in a steady recovery and expansion across much of Europe.
However, not all EU countries experience expansion at the same rate. For example, Germany, with its strong manufacturing sector and export-driven economy, often leads the expansion, while countries with weaker economies, like Greece or Spain, may experience slower or delayed growth. Differences in public debt levels and fiscal policies between countries also play a role in the pace of recovery. - Peak Phase: In the peak phase, economic growth reaches its highest point. Inflation rates often start to rise as demand outpaces supply, and the ECB may begin raising interest rates to prevent the economy from overheating. In the Eurozone, the Harmonized Index of Consumer Prices (HICP), the measure used to monitor inflation, typically informs the ECB’s decisions to adjust rates. During the 2017–2018 period, for example, the ECB began discussing rate hikes as inflation neared its target of 2%.
In countries like France and Italy, inflation might rise more slowly compared to Germany due to differing consumer demand and wage growth. Regional disparities in inflation can affect how different economies experience the peak of the business cycle. - Contraction Phase: As the economy enters the contraction phase, growth slows down, and GDP begins to decline. Unemployment rates typically start to rise, and the ECB may respond by lowering interest rates again to stimulate growth. The contraction phase is often more pronounced in countries with higher levels of public debt or fiscal instability, such as Italy or Spain, as they have less room for expansive fiscal measures compared to countries like Germany or the Netherlands, which tend to have more conservative fiscal policies.
The contraction phase also affects countries differently depending on their industrial base. For example, export-heavy economies like Germany may experience a more rapid slowdown if global demand weakens, while countries with diversified economies, like France, might weather the contraction with less volatility. - Trough Phase: At the trough, the economy hits its lowest point in the cycle. Deflationary pressures may become a concern if inflation falls too low, which can slow economic recovery. In this phase, the ECB may deploy aggressive monetary policies, such as quantitative easing or deep interest rate cuts, to pull the economy out of stagnation. During the 2020 COVID-19 pandemic, the ECB implemented significant stimulus measures, including massive bond-buying programs and historically low interest rates, to mitigate the economic damage across the Eurozone.
Recovery from the trough can be uneven across Europe, with wealthier nations recovering faster due to stronger fiscal positions and more resilient labor markets. Meanwhile, countries with high public debt or weaker financial sectors, like Greece or Portugal, may face prolonged periods of stagnation before recovery begins.
Postać: FTSE 100 vs European Indices
Opis:
This chart compares the performance of the FTSE 100 with major European indices from August 2020 to July 2021. It illustrates percentage growth over time, highlighting the variation in returns among indices like CAC40, FTSEMIB, DAX, IBEX35, SSMI, I UKX (FTSE 100). The graph shows that CAC40 I FTSEMIB had the highest growth rates, while the FTSE 100 lagged behind the other indices during this period.
Najważniejsze wnioski:
- CAC40 I FTSEMIB indices led with growth rates of 29.18% I 27.04%, respectively.
- Ten FTSE 100 experienced the lowest growth rate at 14.37% among the listed indices.
- Ten DAX I IBEX35 indices showed moderate growth rates of around 19%.
- The chart highlights divergence in recovery patterns among European stock markets after the 2020 downturn.
Zastosowanie informacji:
This chart helps investors understand the relative performance of European stock indices, which can guide decisions in diversified investment strategies. It emphasizes the importance of comparing regional indices to capture potential growth opportunities and assess market resilience. Investors can use this information to adjust their portfolios based on market trends and risk appetite.
Najważniejsze informacje dotyczące lekcji:
- Ten global stock market operates through two main venues: regulated stock exchanges and less regulated OTC markets. Each has its advantages and risks, impacting the transparency, liquidity, and safety of investment.
- Derivatives play a critical role in financial markets by allowing investors to hedge risks or speculate. Understanding the types of derivatives and the markets where they are traded can enhance strategic investment decisions.
- Fractional ownership through stocks makes investing accessible and allows for portfolio diversification, reducing risk while providing opportunities for growth by investing in a variety of sectors and companies.
- Ten supply and demand for stocks are influenced by numerous factors, including corporate earnings, investor sentiment, and macroeconomic indicators. Recognizing these can aid investors in making more predictive and strategic investment choices.
Oświadczenie końcowe
By mastering these fundamental concepts of how stock markets function, the role of derivatives, the benefits of fractional ownership, and the dynamics of supply and demand, you are well-prepared to navigate the complexities of investing and to capitalize on opportunities within the global financial markets. This knowledge forms the bedrock for successful investment strategies and long-term financial planning.
